Facebook Insights
The Facebook Insights tab gives you an overview of your performance on the channel for the selected date and profiles.
Accessing Facebook Insights:
To access FB Insights, click on the Local Insights drop-down and choose Facebook Insights.

Dashboard Filters:
Once you are on the Facebook Insights screen, click on the ‘settings’ button, and 3 options will appear – Chart Type, Group, and Widgets.

By clicking on the Chart type, you can choose a chart or layout that suits your preference.
 .
.
You can choose the default setting, line chart, area chart, bar chart, and pie chart. If you choose a chart type apart from the default setting, it will change only if it is applicable and can display the widget in that particular format.
By clicking on the ‘group’ option, you can choose to view data for a day, week, or month.

On the Google Insights tab, you can choose to view the data of up to 7 widgets. Choose ‘all’ to view all the widgets or handpick that you wish to view.

Next, you can view multiple KPIs just by clicking on them, and this will allow you to make a comparison.

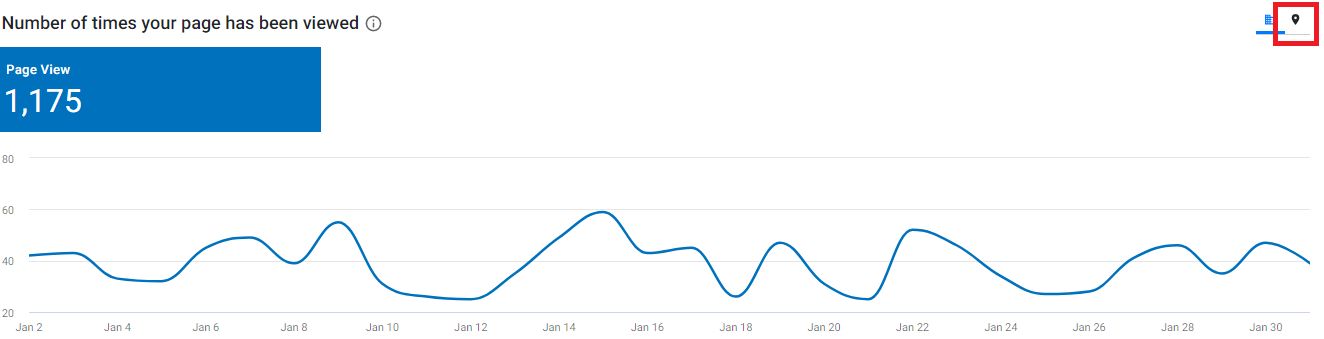
Now, for every widget that you have selected, you can choose to have the aggregated view (combination of the performance of all profiles) or can choose to view the performance of each business profile if you click on the location sign.
With Facebook Insights, you can view:
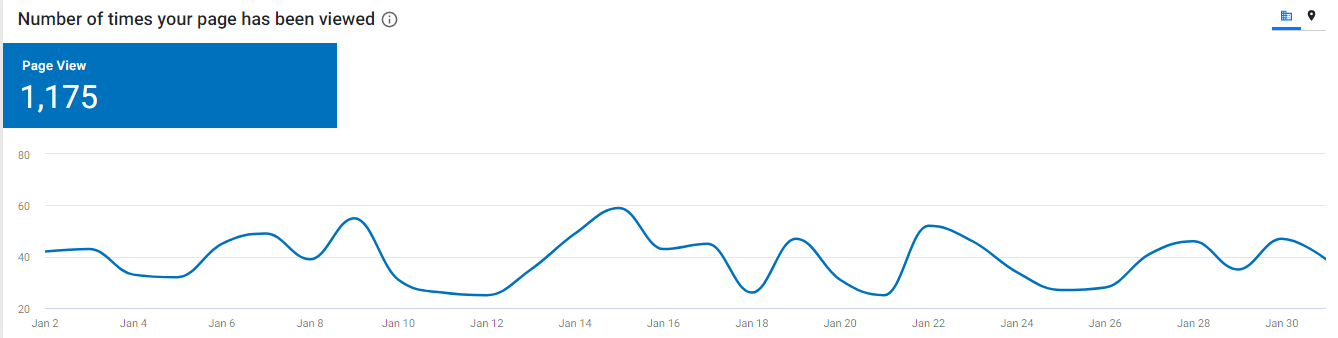
1. Number of times your page has been viewed:
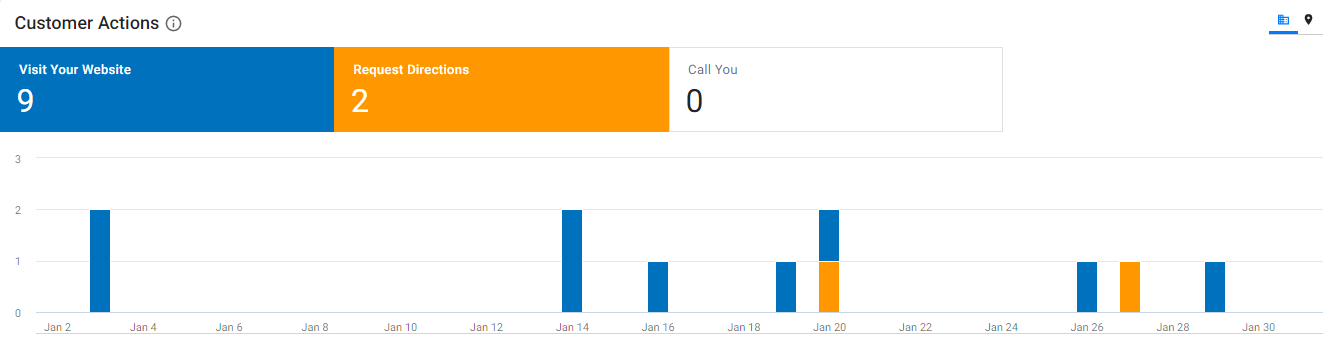
2. Customer actions - Website visits, direction requests, calls
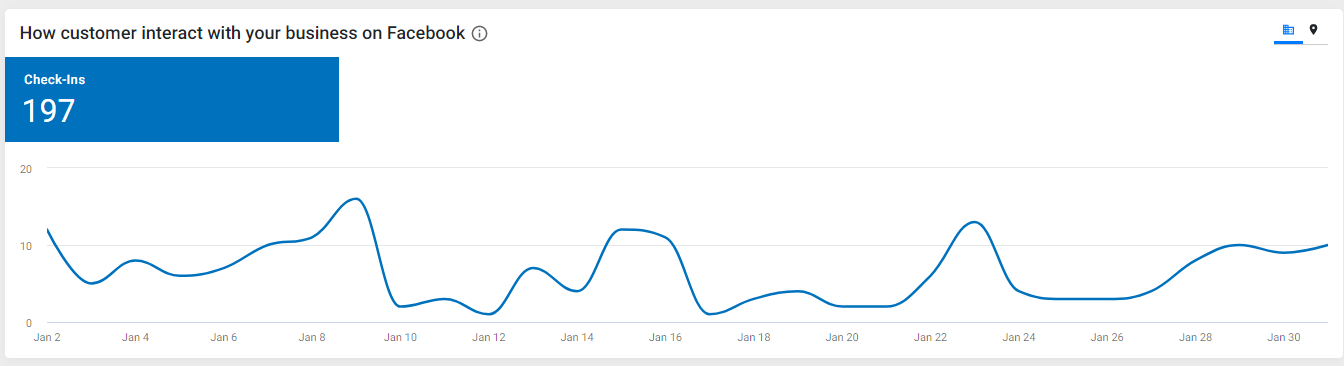
 3. How customers interacted with your business on facebook - Check-ins
4. Fans

Finally, you can export your Facebook Insights data by clicking on the 'export' button and choosing the type of file.
