Release: Aug 2, 2021
Local
1. Real-time Reviews for Facebook
Opportunity: Local isn't about directory listings anymore; engaging with customers is an imperative part of your local strategy, and responding to reviews in near real-time give businesses another opportunity to show customers (and search engines) that they care.
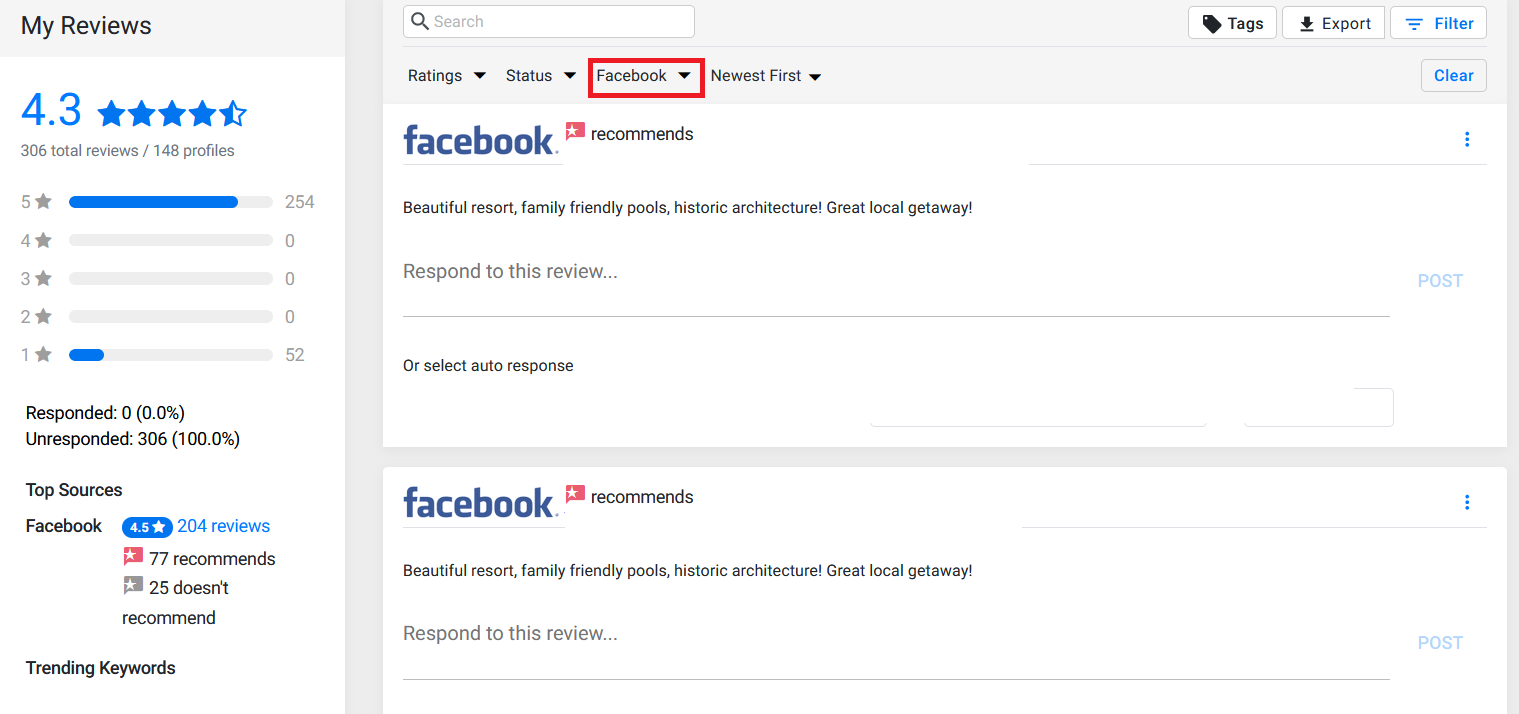
Solution: The ‘My Reviews’ section will now refresh more often to provide the latest reviews posted on Facebook by customers.
MPC > Reviews > My Reviews
From the ‘My Reviews’ page, select the Reviews Source as ‘Facebook’ to see the latest reviews
Insights
1. Page Experience Report to assess the Core Web Vitals performance of a business website
Opportunity: Measure the Core Web Vitals of your website to know how your customers are experiencing your web pages. With the core web vitals an official ranking factor, it is important to ensure your Core Web Vitals are up to the mark.
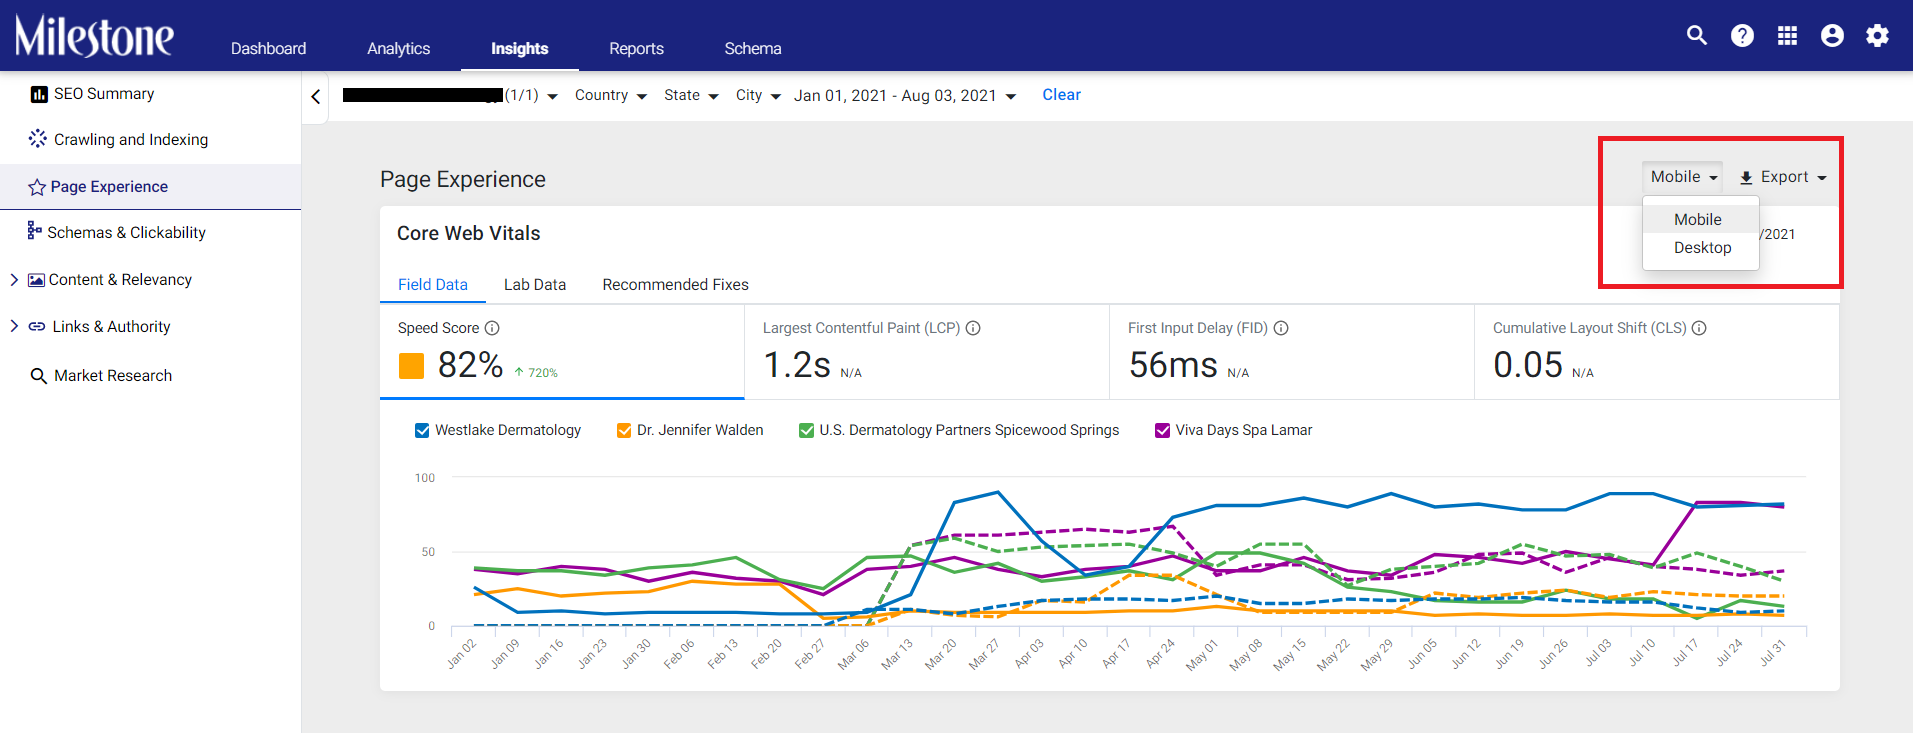
Solution: Core Web Vitals is now included in the Page Experience section to allow you to view the performance of your pages. It also provides tips on improving a page’s Core Web Vitals.
MPC > Insights > Page Experience
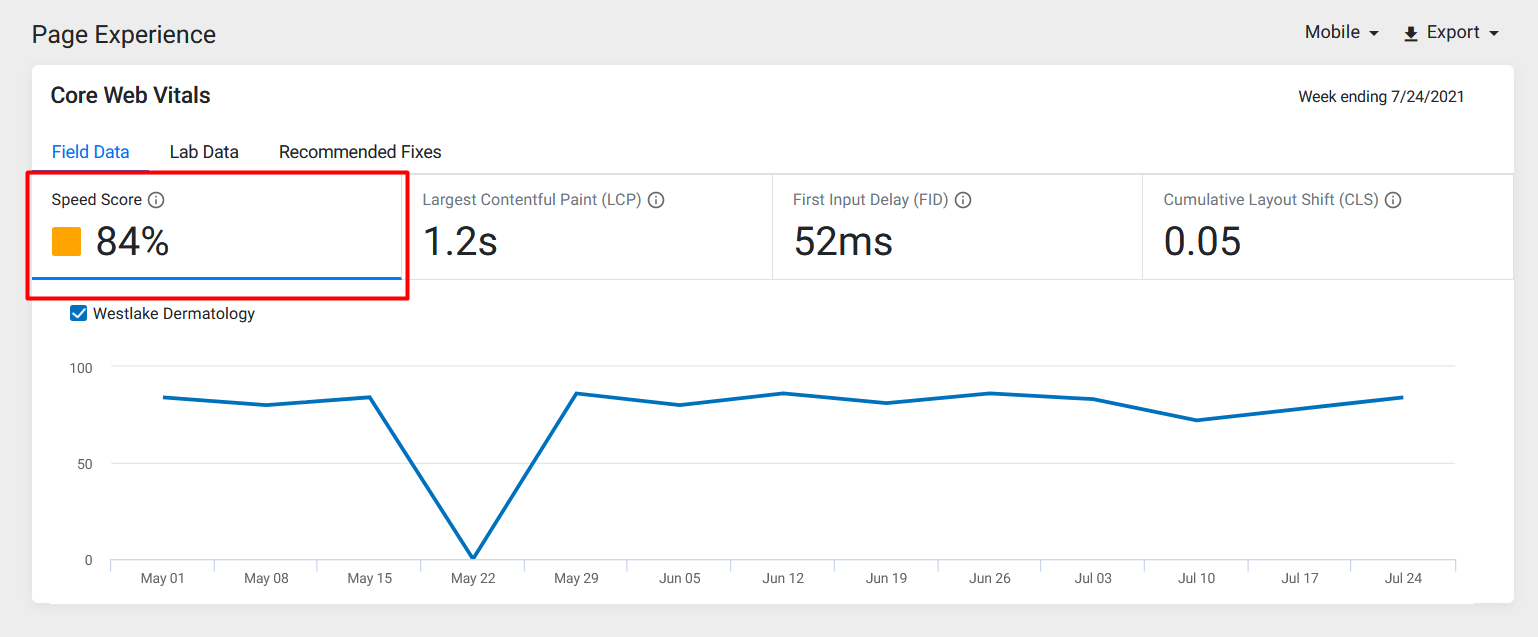
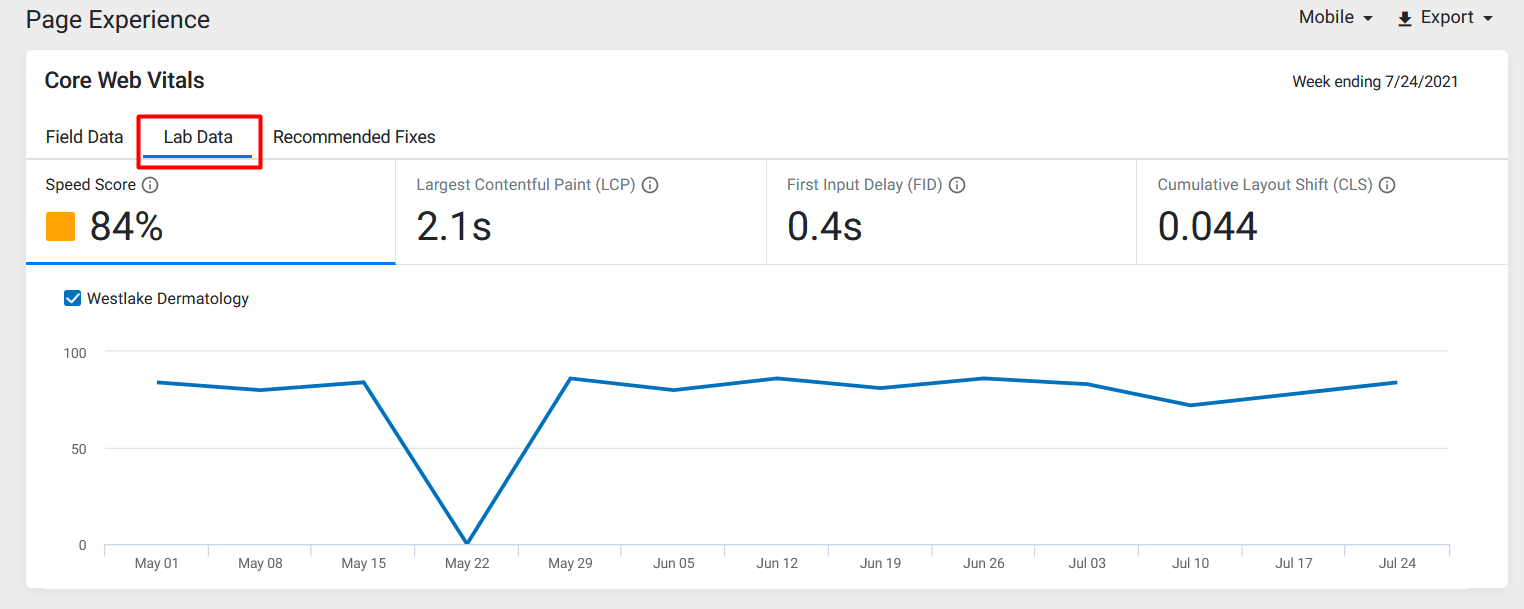
The ‘Core Web Vitals’ section under ‘Page Experience’ shows the three metrics considered while calculating the Core Web Vitals of a page: Largest Contentful Paint (LCP), First Input Delay (FID) and Cumulative Layout Shift (CLS).
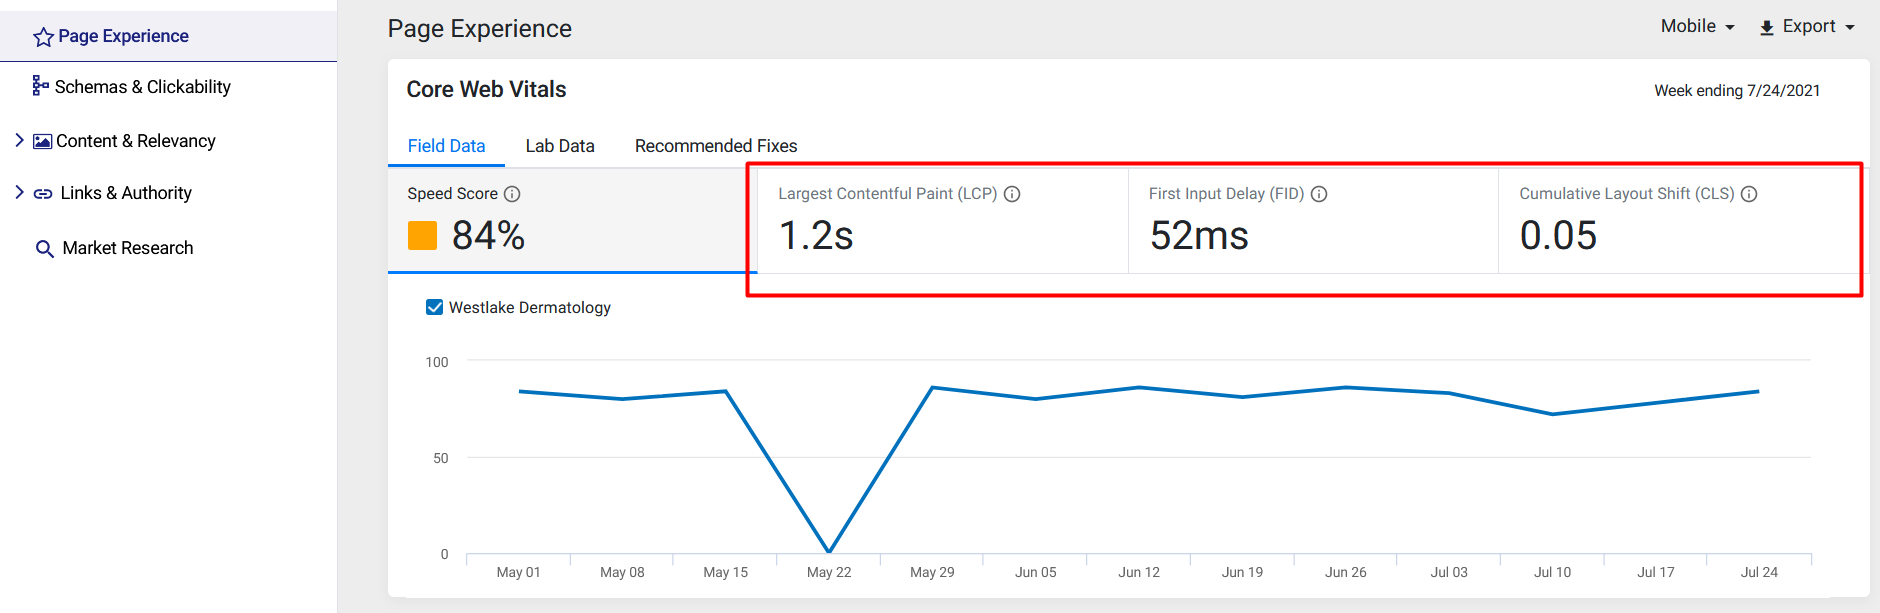
Taking all of this into consideration a ‘Speed Score’ is provided. A Speed Score above 90 is good.
There are three tabs under which a user can check the Core Web Vitals.
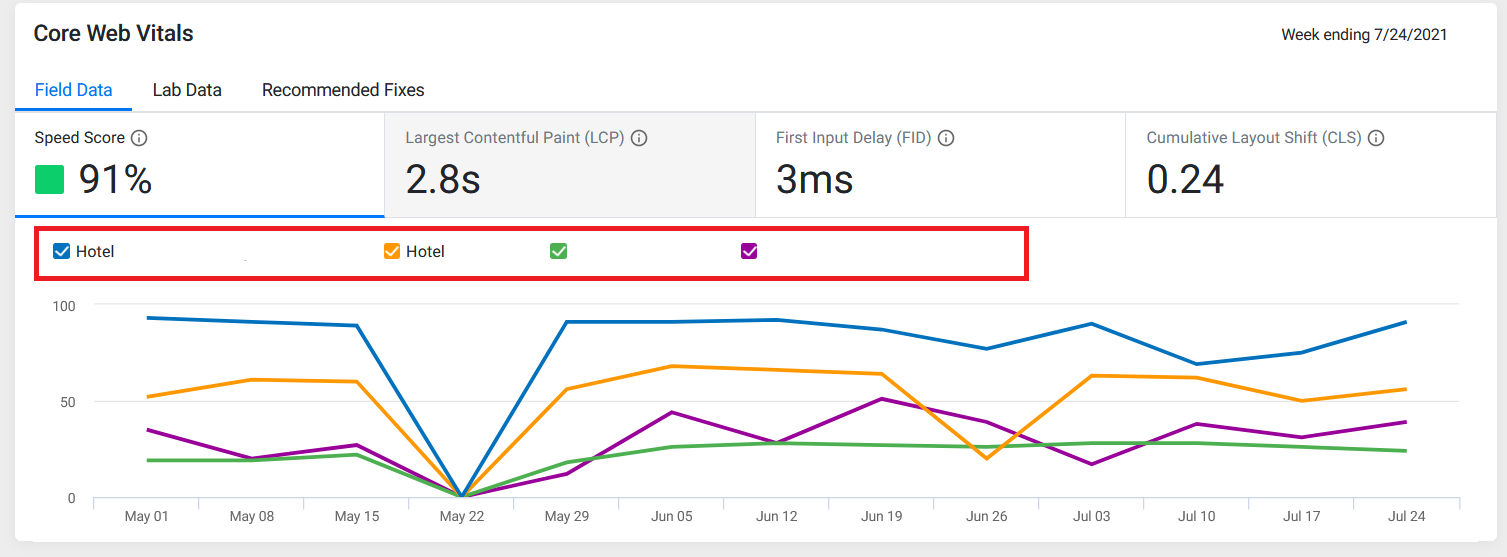
Field Data: Field Data is data collected from actual page users.
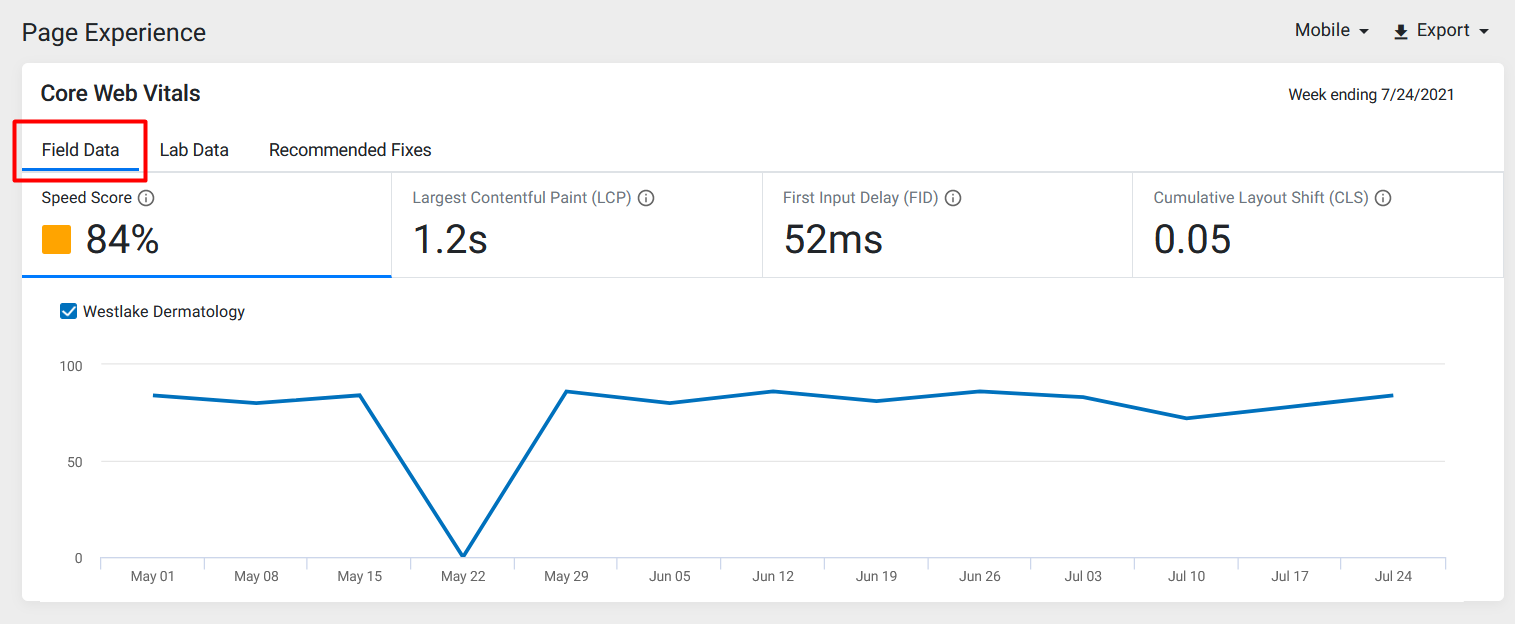
Lab Data: Lab Data is data collected during testing on tools like Lighthouse.
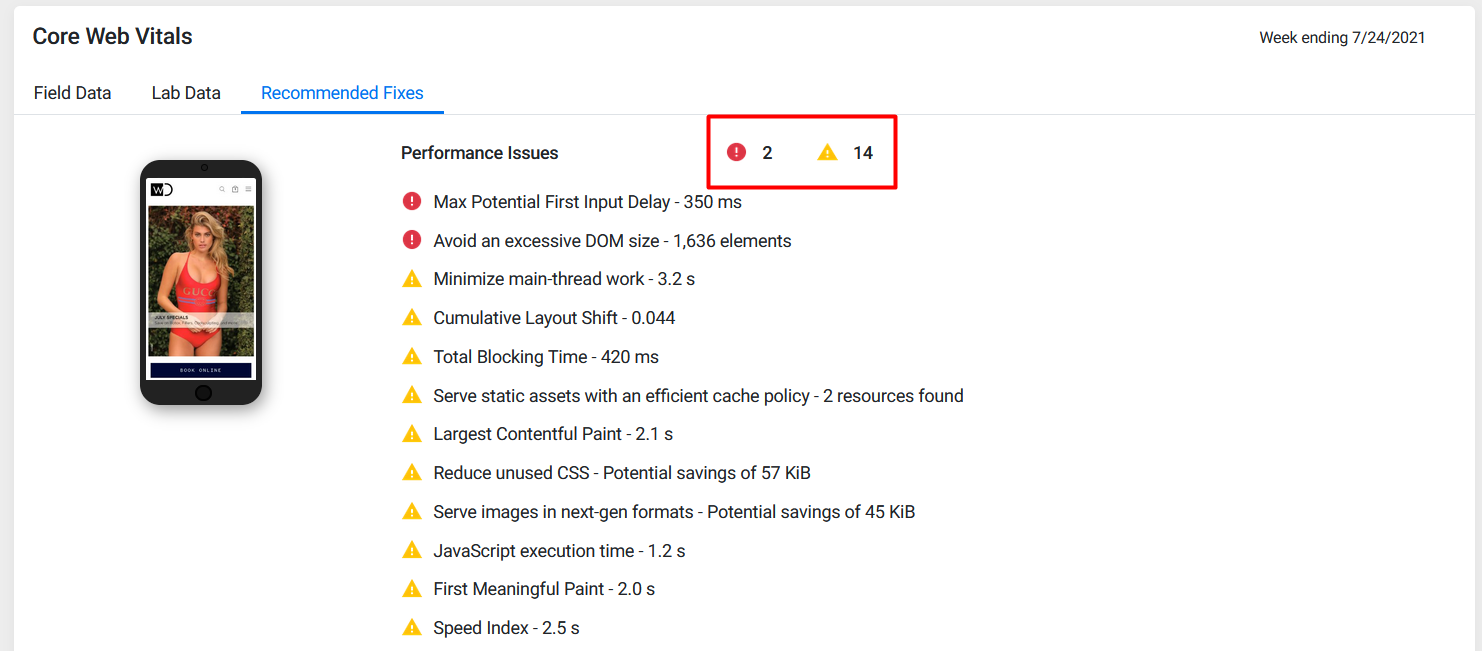
Recommended Fixes: The ‘Recommended Fixes’ tab provides you tips to improve your page’s Core Web Vitals. These are provided as Errors, Warnings, and information related to the performance issues of your website.
If you have competitors added, you can also view and compare your Core Web Vitals with their pages
You can view the Core Web Vitals performance of your business website for both Mobile and Desktop.
Analytics
1. Expandable and Collapsible sections in the Digital Performance Report
Opportunity: Improve the experience of the user viewing the Digital Performance Report
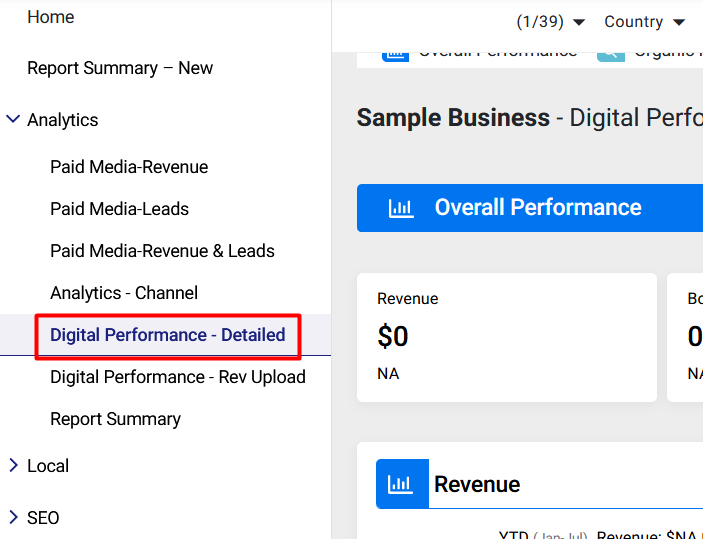
Solution: When you click on ‘Digital Performance’ reports the default screen will now show you the Overall Performance and other reports like Organic and Local reports remain collapsed until you wish to view them.
MPC > Reports
Select the Profile for which you wish a view the Digital Performance Report and click on ‘Apply’
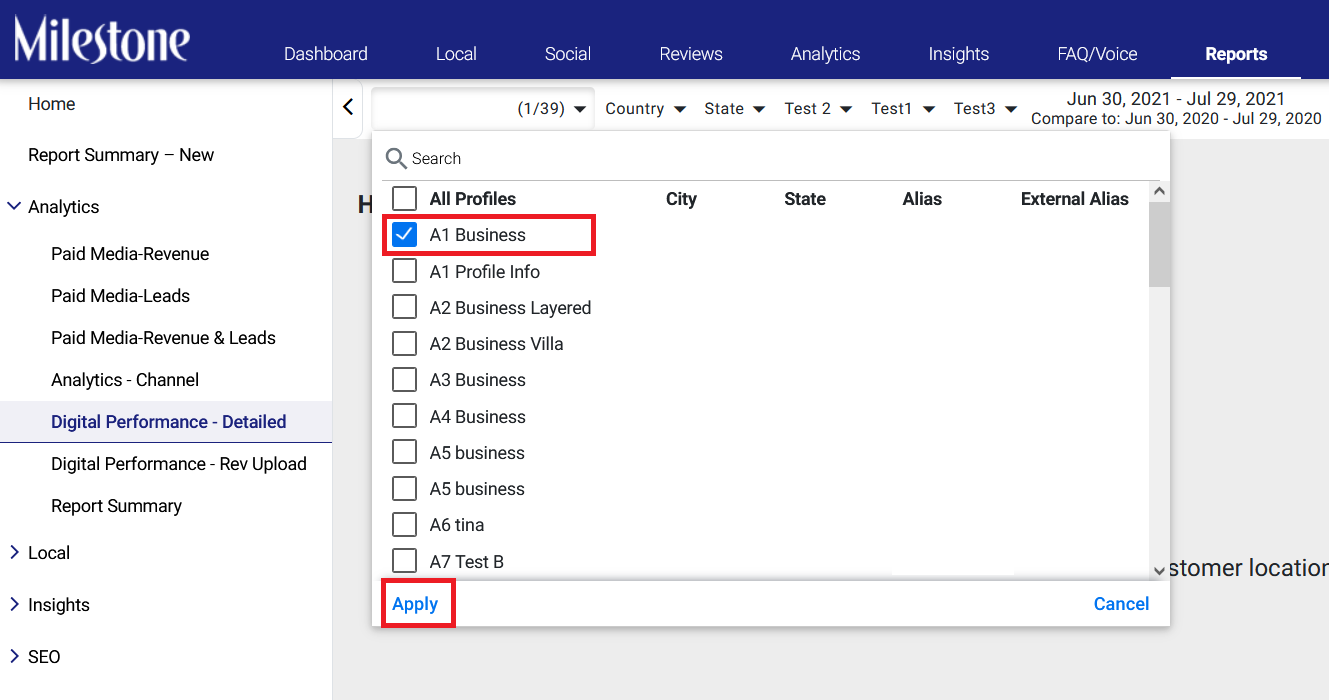
From the left navigation panel in the ‘Reports’ section, navigate to ‘Analytics’ and Select ‘Digital Performance - Detailed’
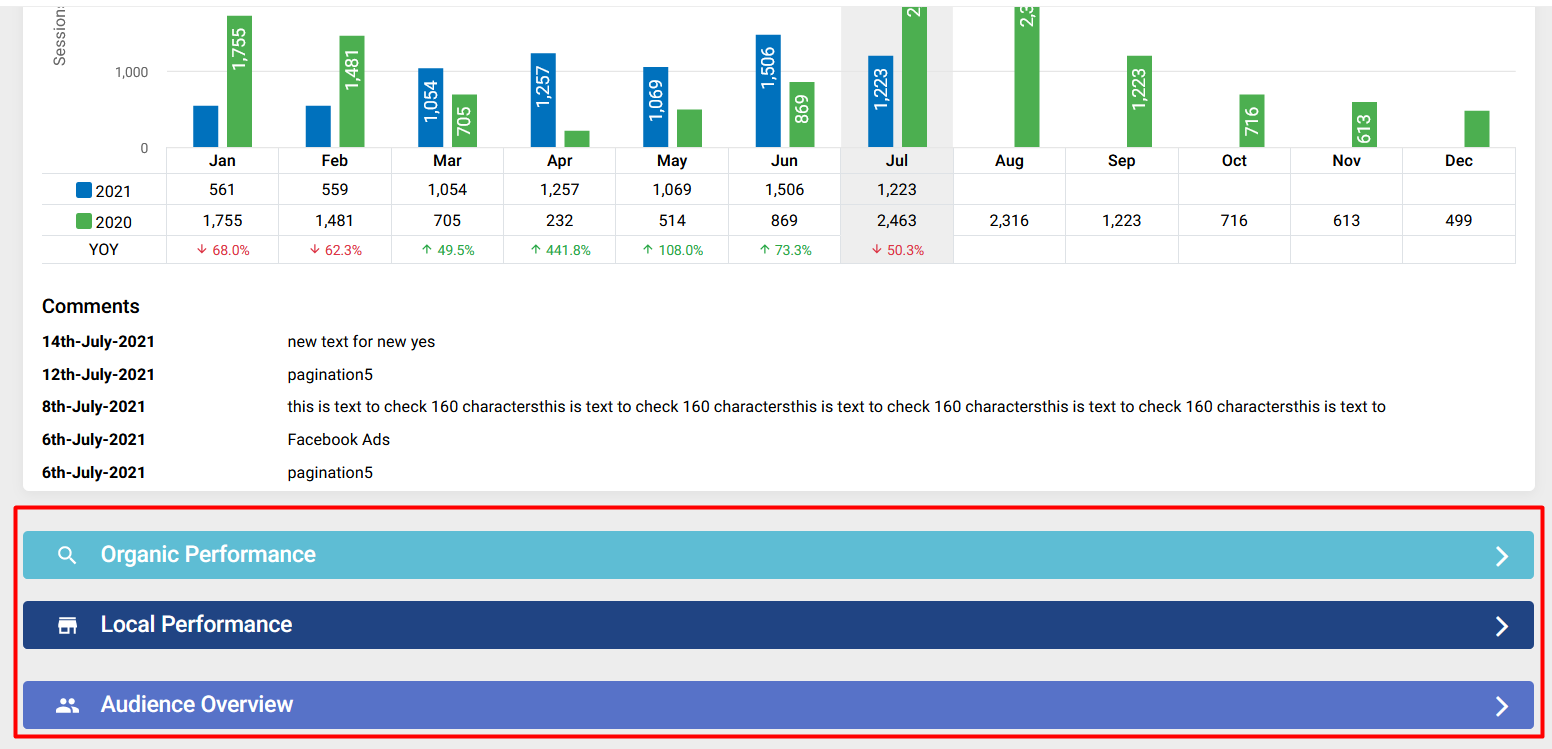
You can click on the expandable blocks at the bottom of the page to view other Performance Reports you have added to your profile
Note: This change is limited to Digital Performance Report UI preview only, no change in PDF report.
2. ‘Brand Search Volume’ new KPI added to Paid Media Performance
Opportunity: Check the number of times your brand has appeared in search queries over a period to assess the impact of your brand campaigns on search
Solution: We have added ‘Brand Search Volume’ to the KPIs for your Paid Media Performance. This will allow you to see how often you are being searched for and how effective your digital strategy is.
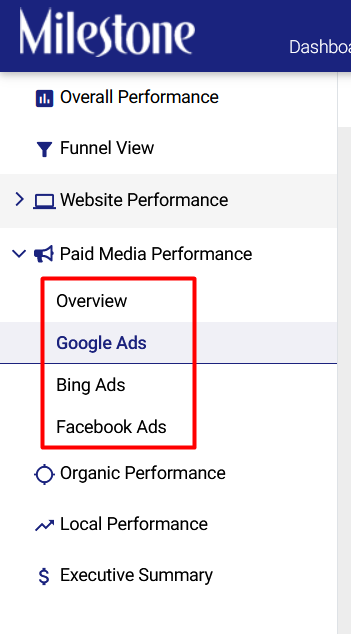
MPC > Analytics > Paid Media Performance
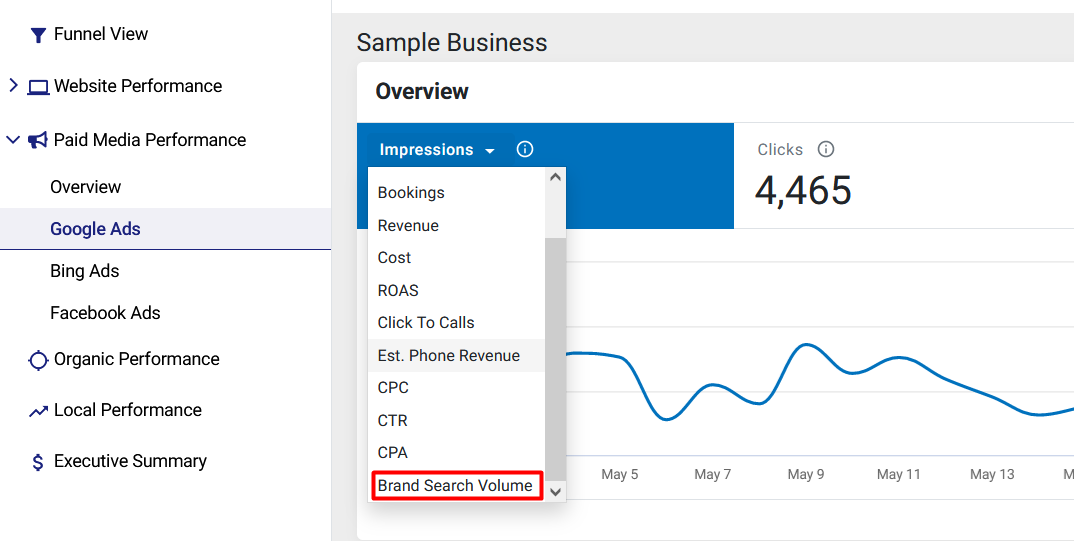
Under ‘Paid Media Performance’ select Google Ads to view the performance report for the Brand Campaign.
Select ‘Brand Search Volume’ from the KPI dropdown
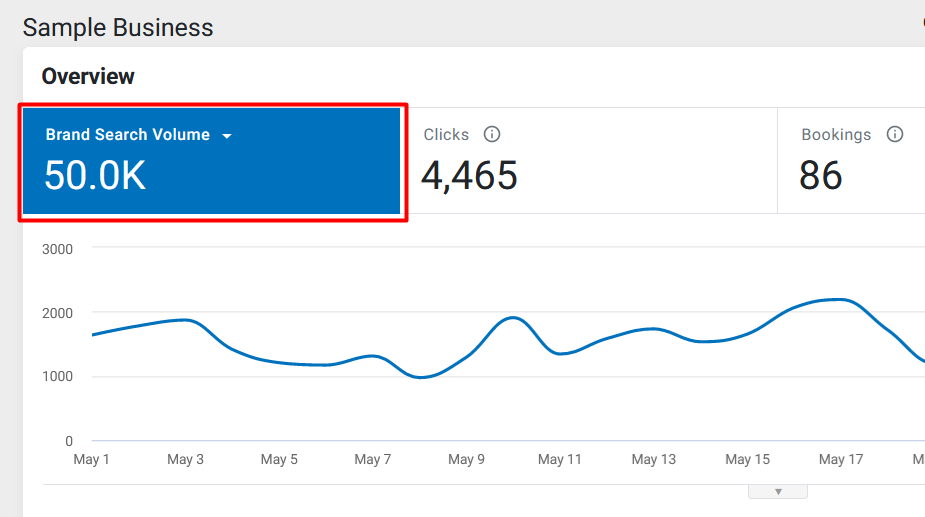
You can scroll down to the Paid Search Campaigns can see the performance of your Brand Campaigns
Select ‘Brand Search Volume’ as one of the Columns in Paid Media Search
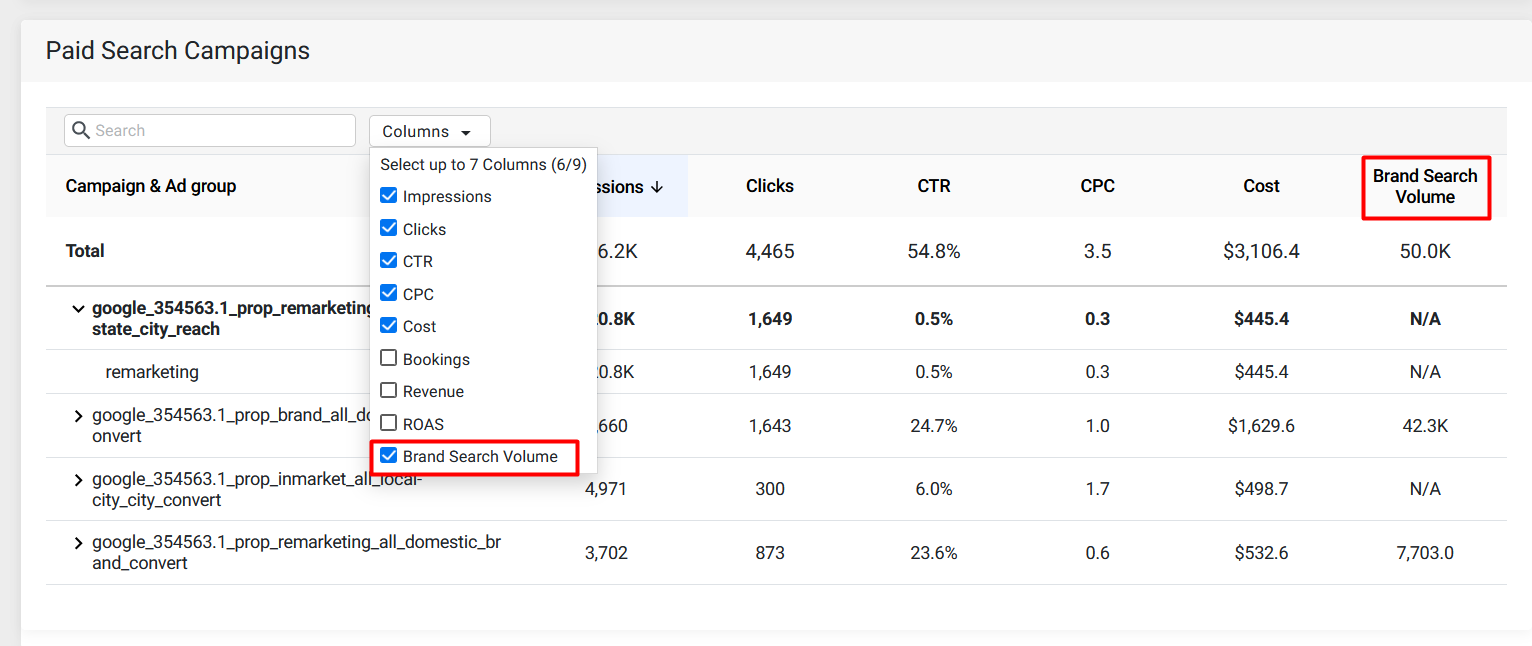
Please Note: Only Brand Campaigns will display in the Brand Search Volume.
In addition, you can also access ‘Brand Search Volume’ from the ‘Reports’ section
From ‘Analytics’ on the left navigation panel select ‘Paid Media – Performance'
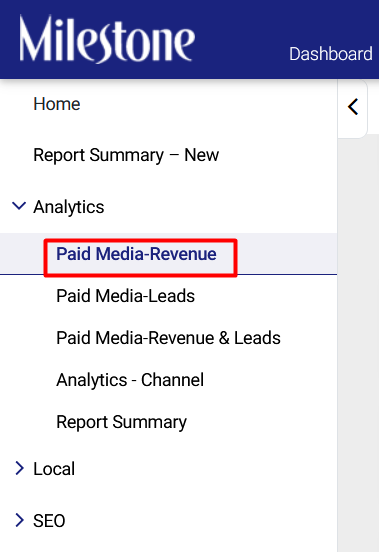
Scroll down to the ‘Google Ads’ section and check the ‘Brand Search Volume’
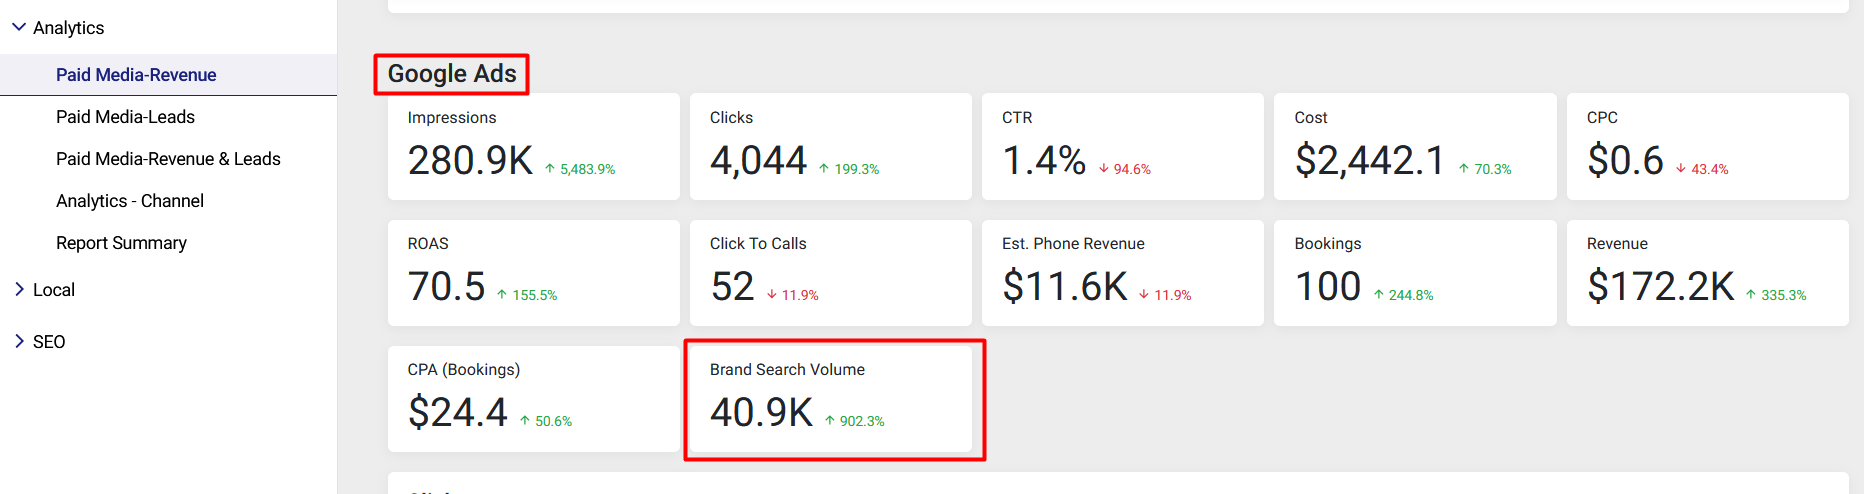
The ‘Brand Search Volume’ will also be displayed on the ‘Monthly Performance’ report
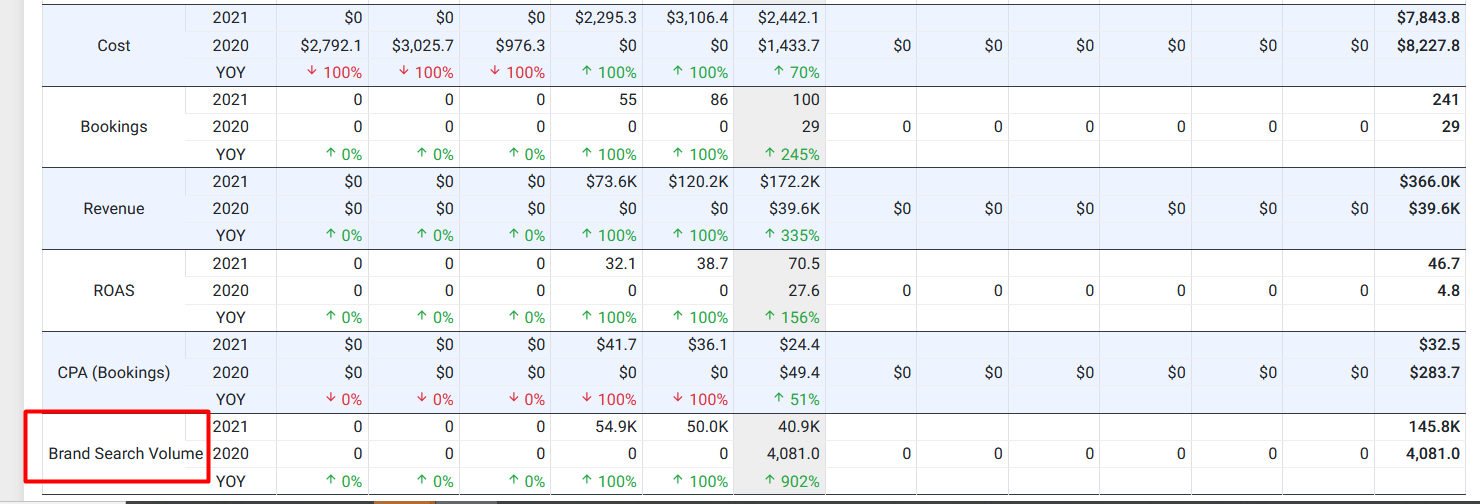
3. Monthly Performance Table in Paid Media Report
Opportunity: View the monthly performance of KPIs across all channels in one place
Solution: You can now view the performance of your KPIs across all channels in the ‘Monthly Performance’ table.
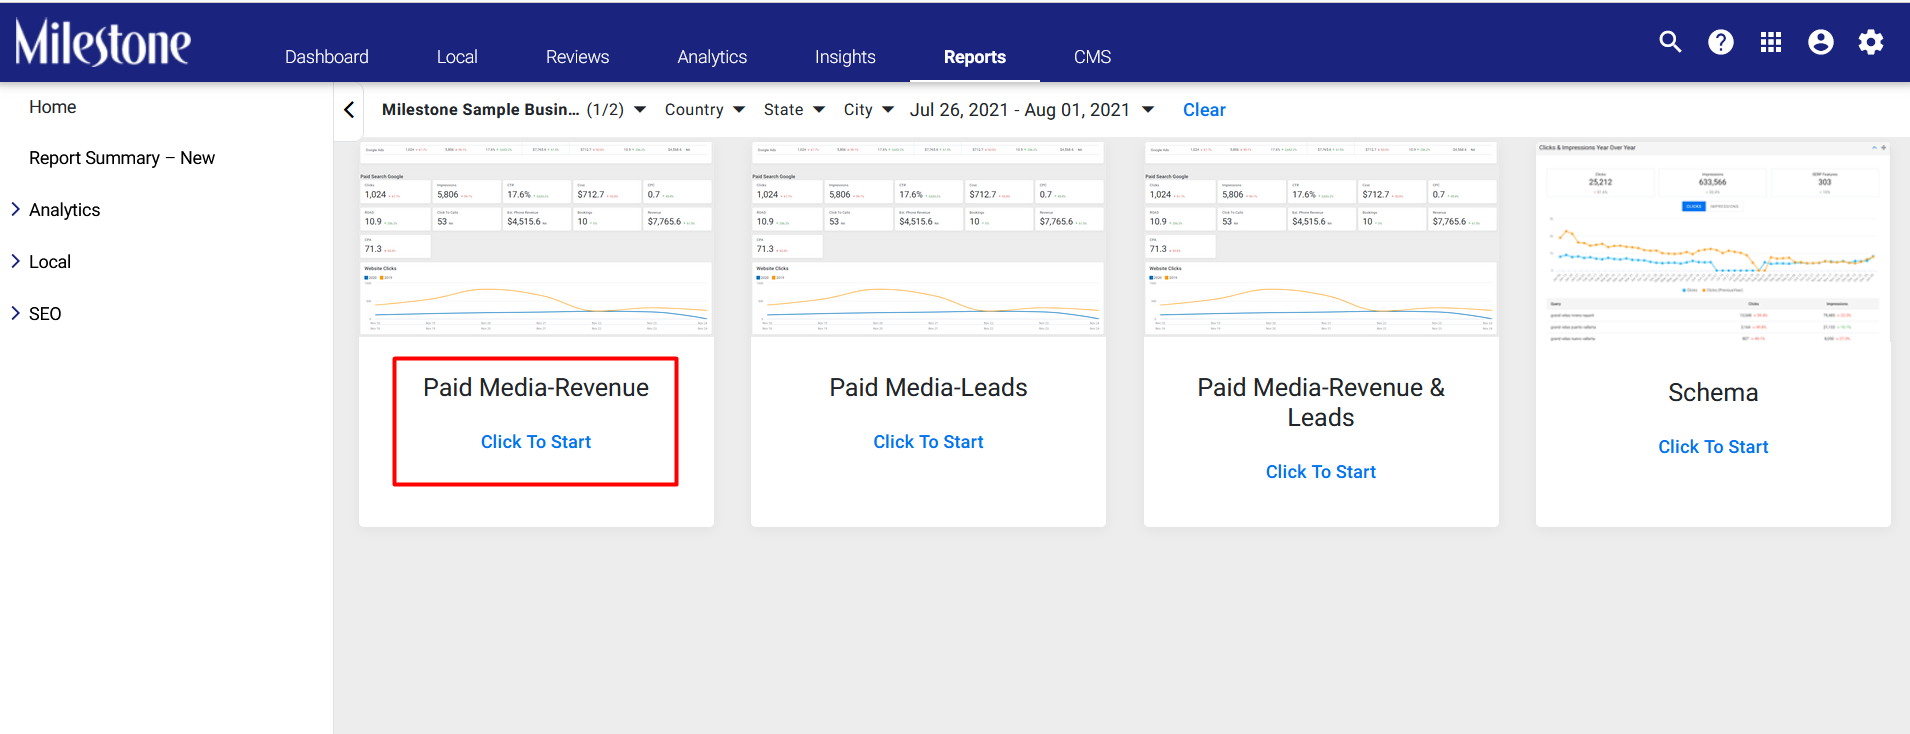
MPC > Reports
From the ‘Reports’ section, select ‘Paid Media – Revenue'
Select the date range for which you want to view Performance Reports
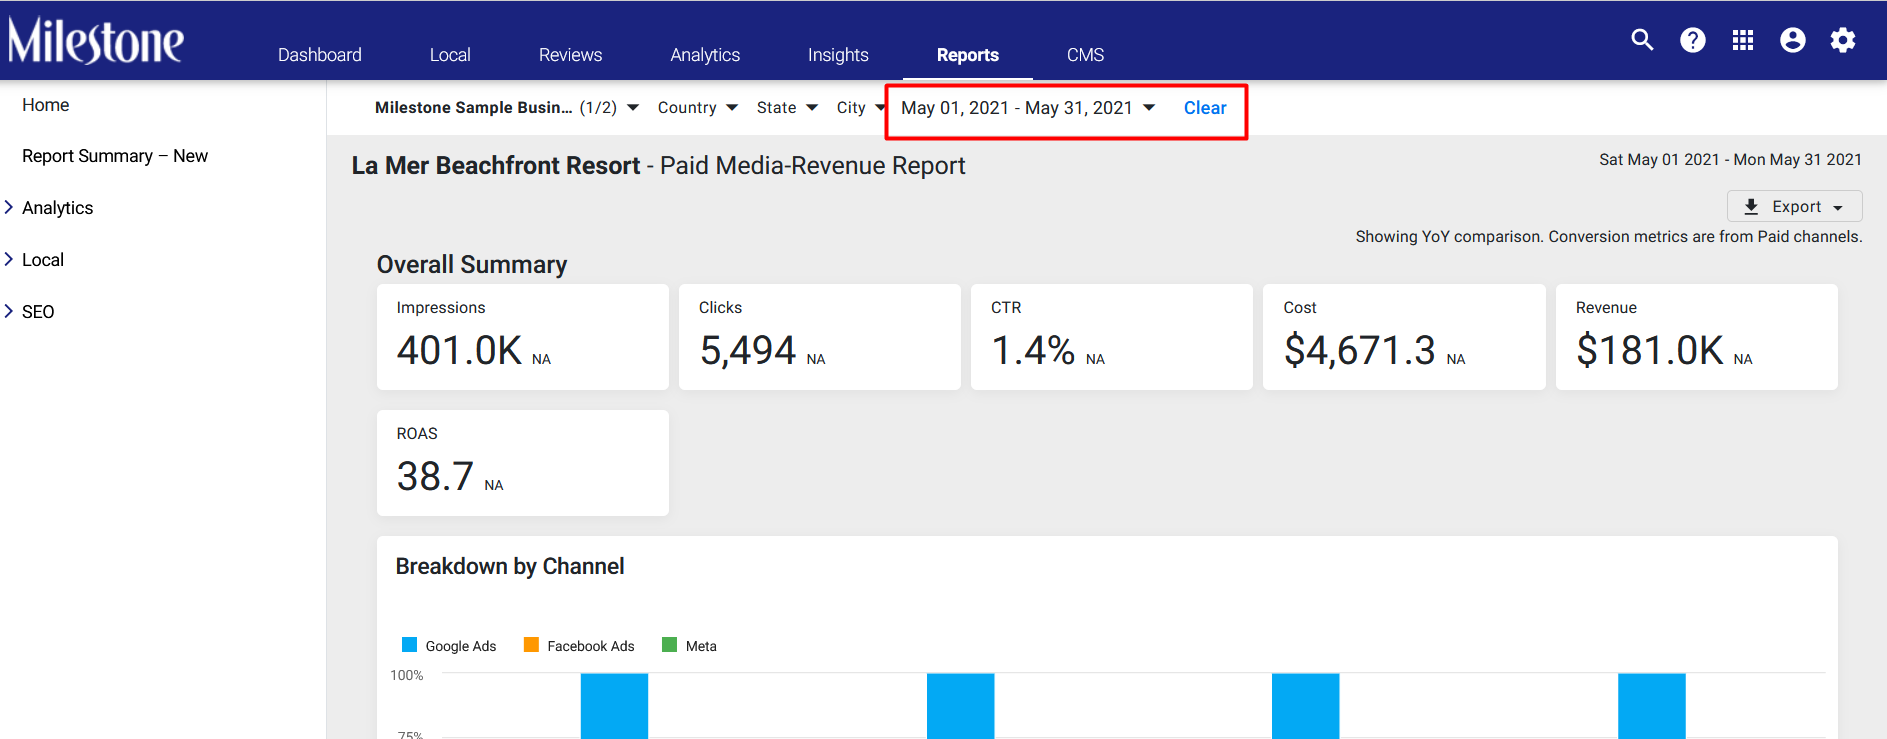
From the ‘Reports’ section, scroll down to view the ‘Monthly Performance Reports’ for your KPIs.
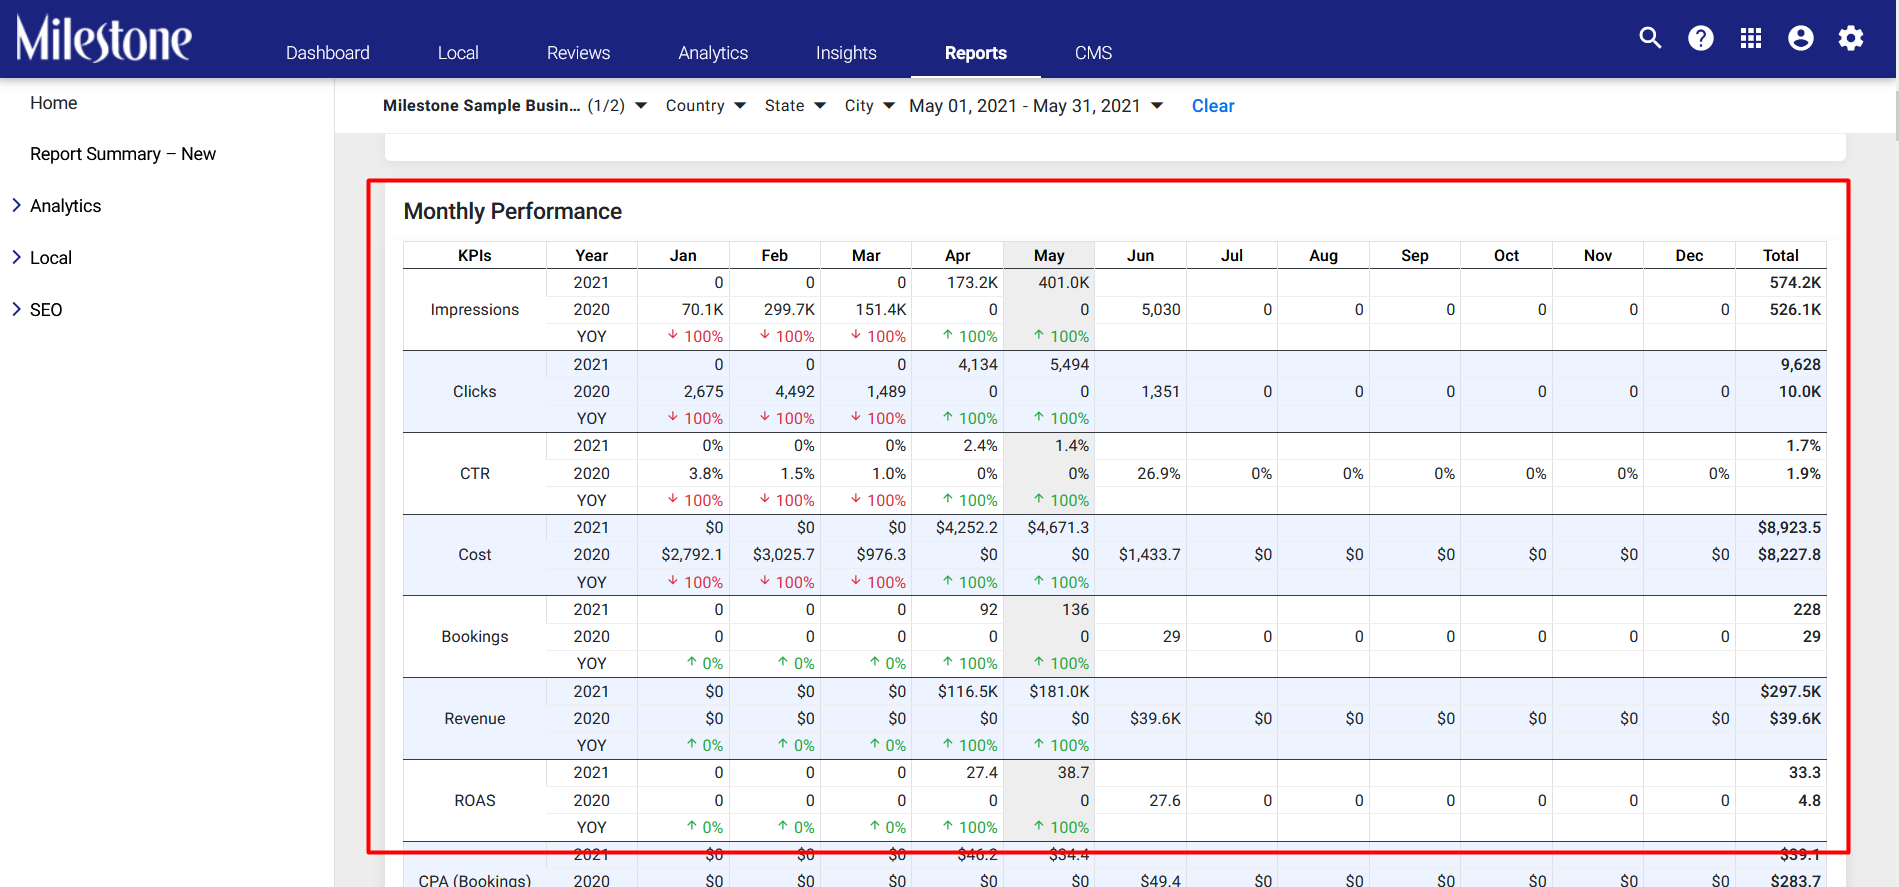
Please Note: The ‘Monthly Performance Report’ will always show a Year-over-Year comparison.