Competitive Summary
The Competitive Summary section within Milestone Insights displays comparative data between your business and its competitors across 5 parameters that define the value of SEO and are ingredients to drive visibility for your business on search. The data displayed here is for the parameters - crawling and indexing, page experience, schema and clickability, content and relevancy, and local & authority. Note that all data corresponds to the date range and profile selected.
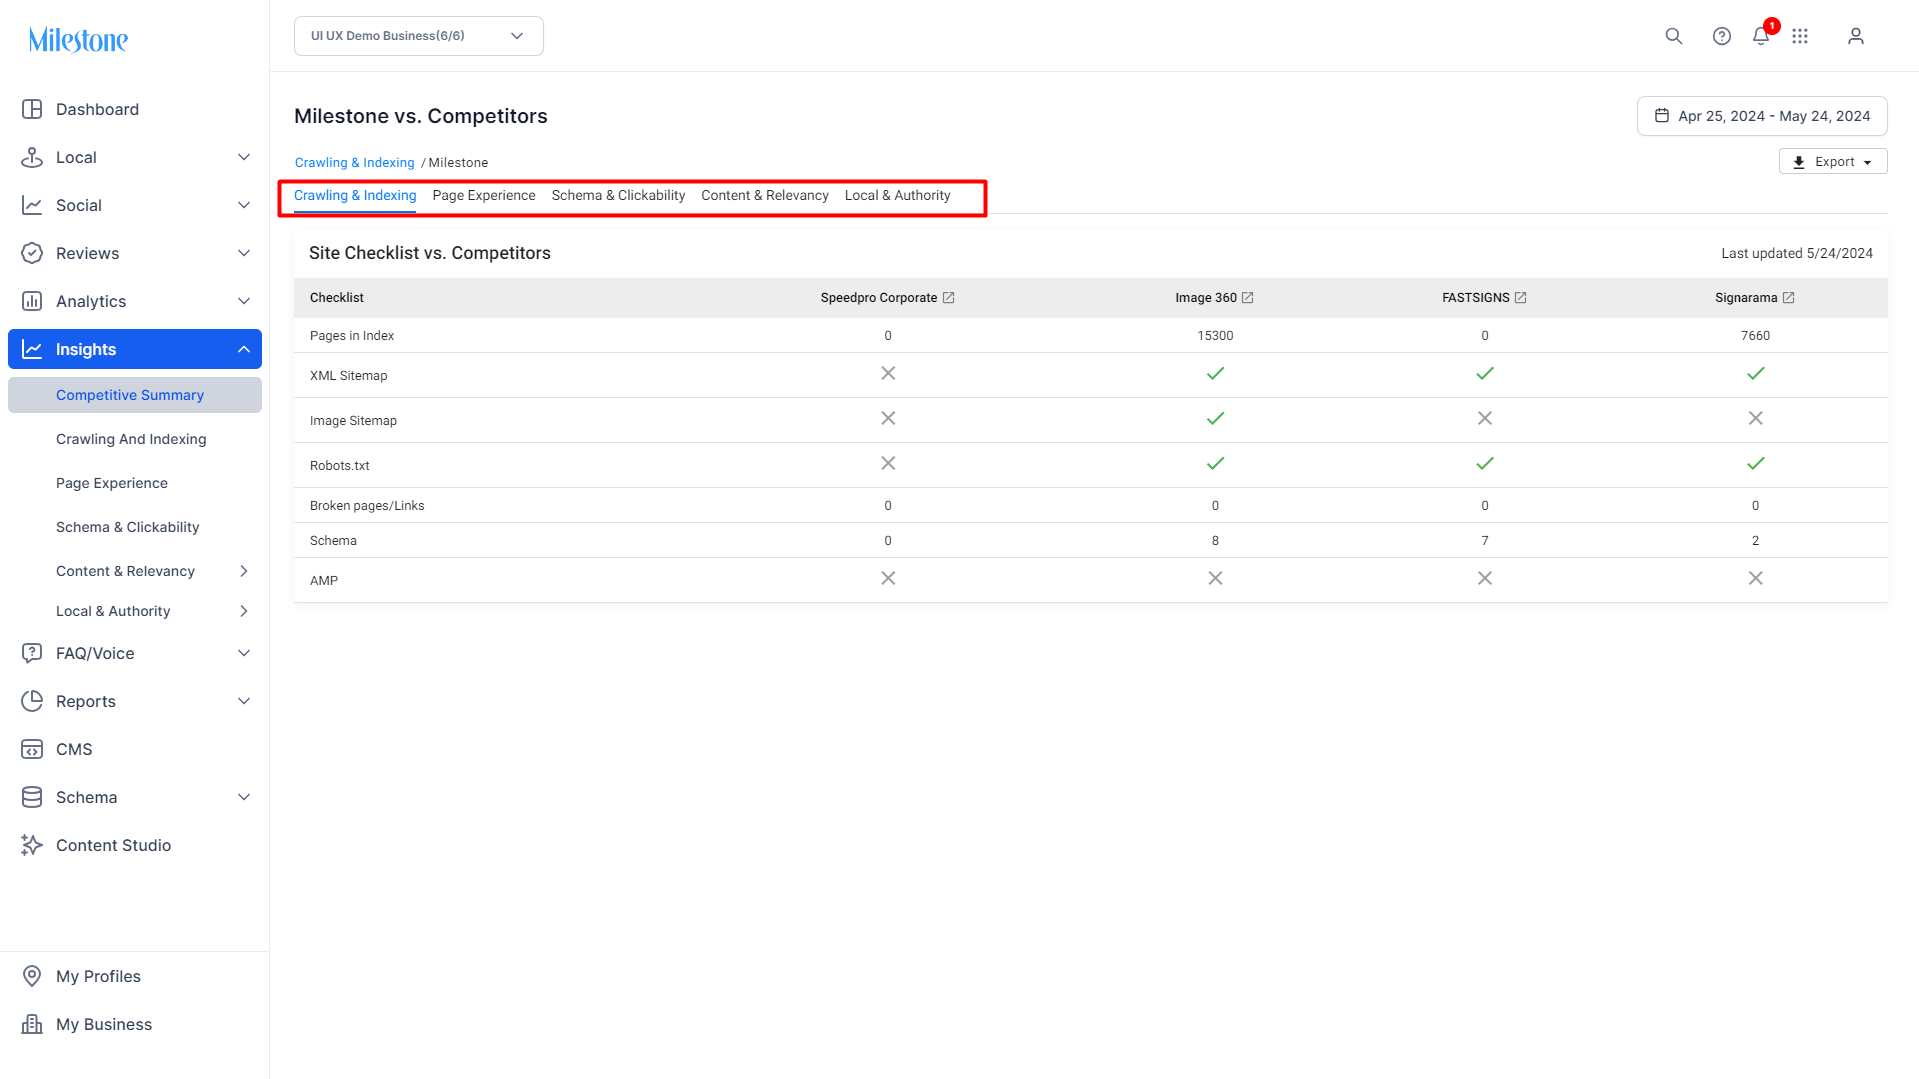
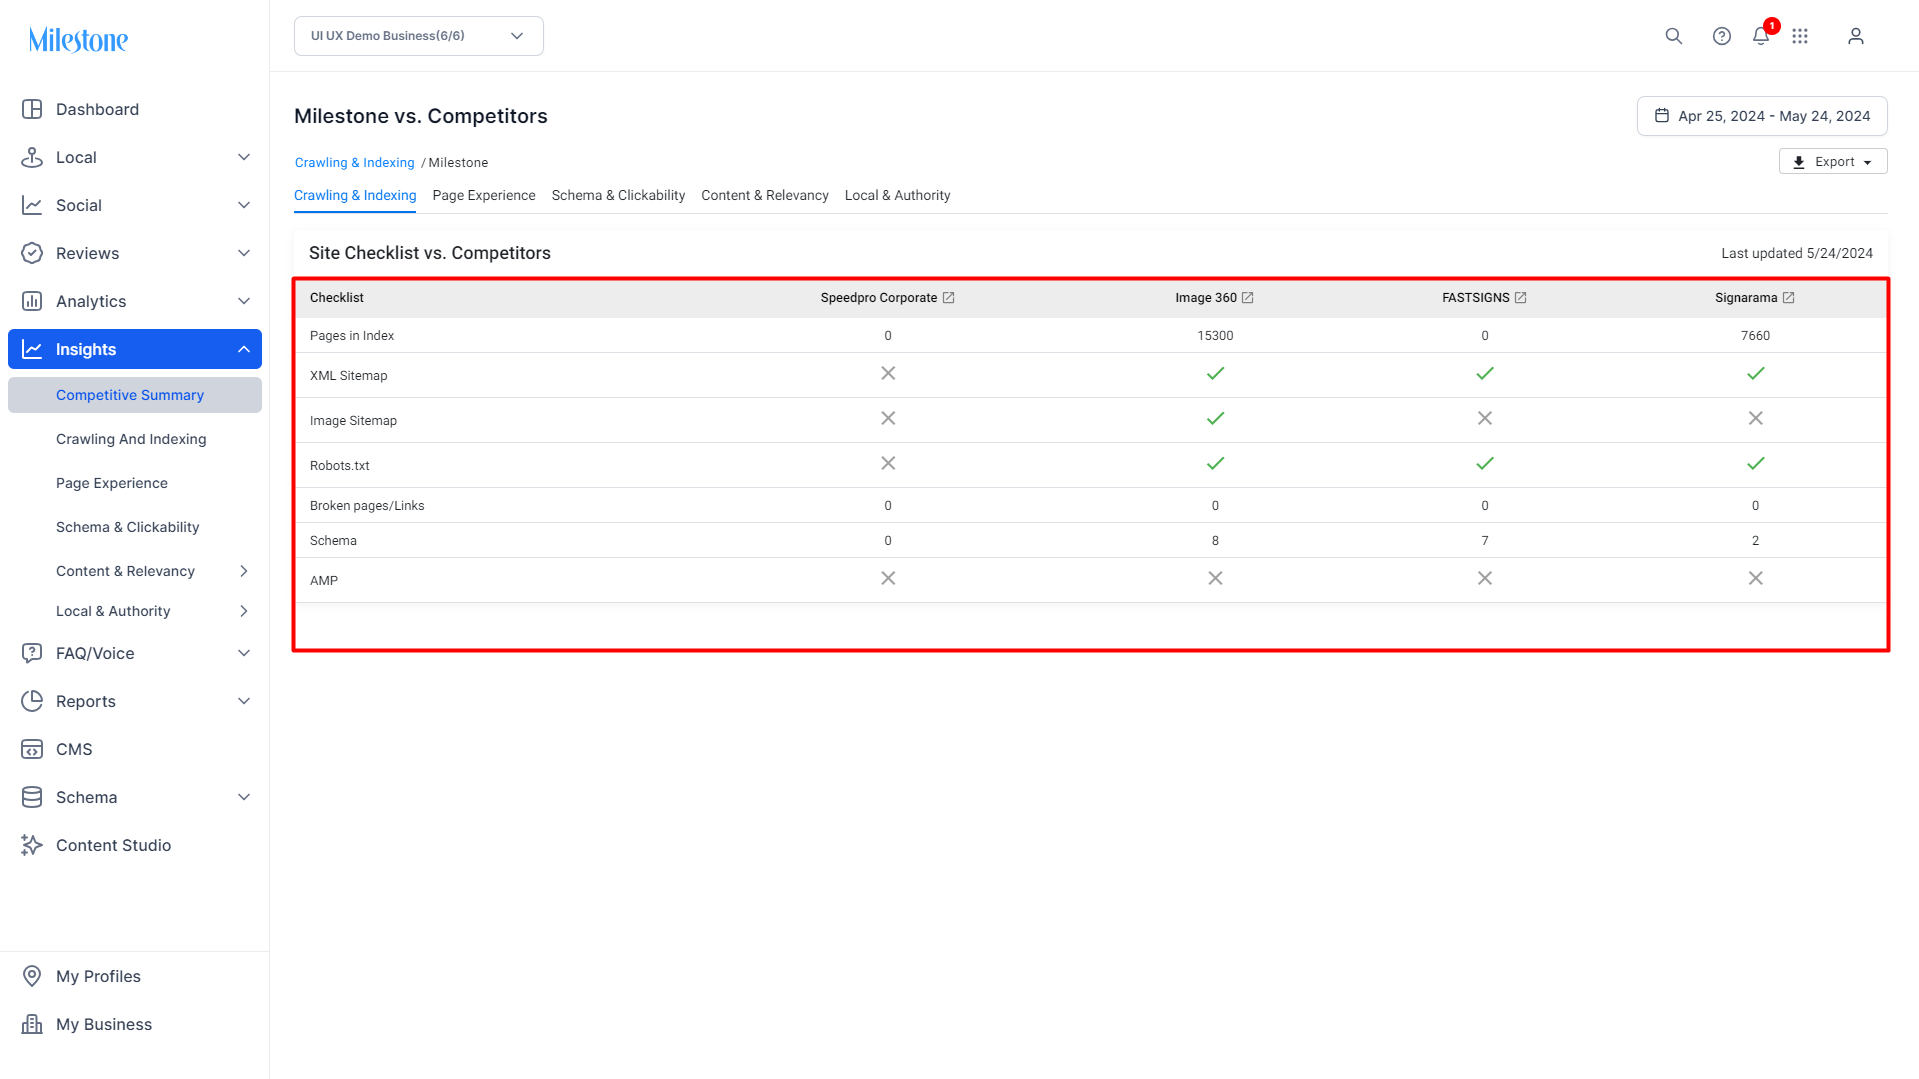
Crawling and Indexing
The crawling and indexing section displays the number of pages indexed by search engines and a checklist of items that are crucial to efficient page crawling and indexing. Here you can check the existence of factors such as XML and image sitemap, robot.txt, AMP, etc.
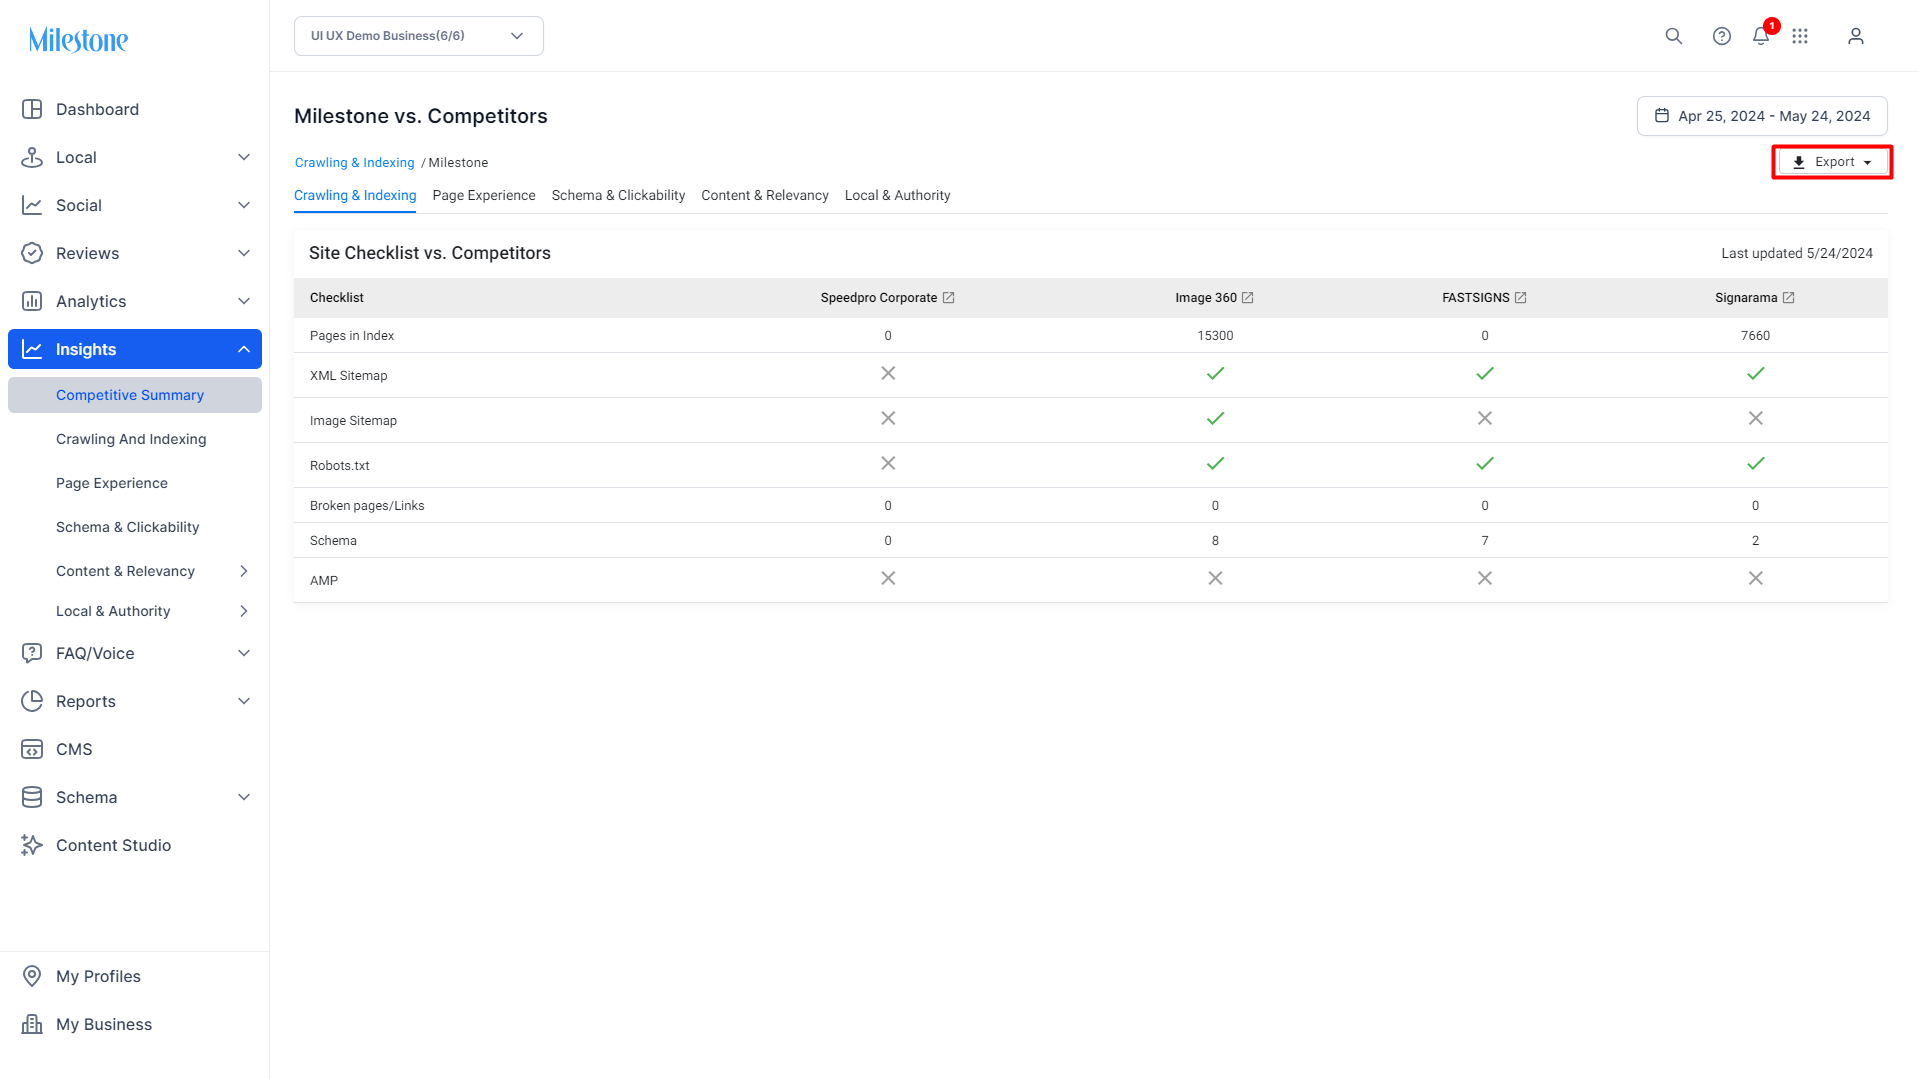
To the top right of this section, you can use the export button to create a PDF report of the entire competitive summary data for redistribution and offline viewing.
Page Experience
Aligning with Google's Page Experience ranking factor, the Page Experience section of the competitive summary displays the overall page experience your website is delivering to visitors.The parameters used to determine the page experience are aligned to Google’s Page Experience parameters, which are, Speed Score, Largest Contentful Paint (LCP), Firstinput delay (FID) and Cumulative layout shift (CLS).
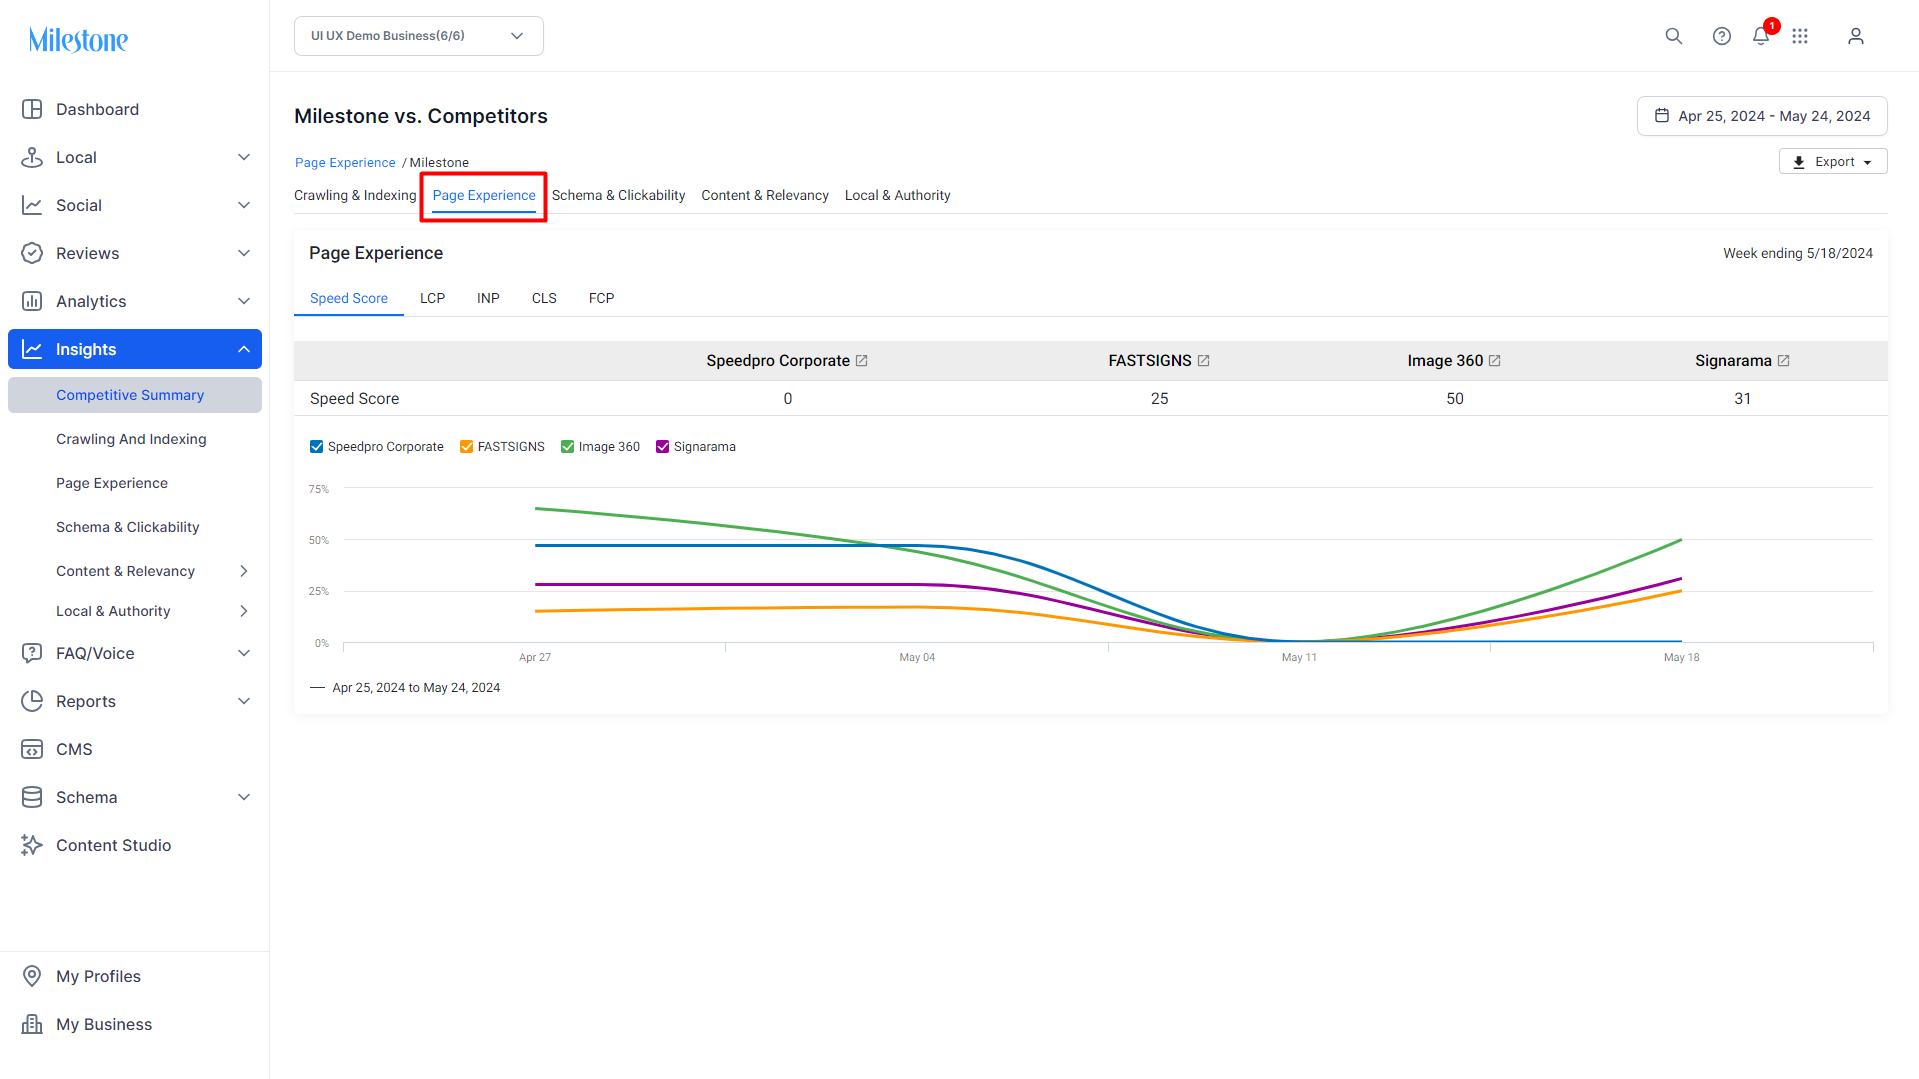
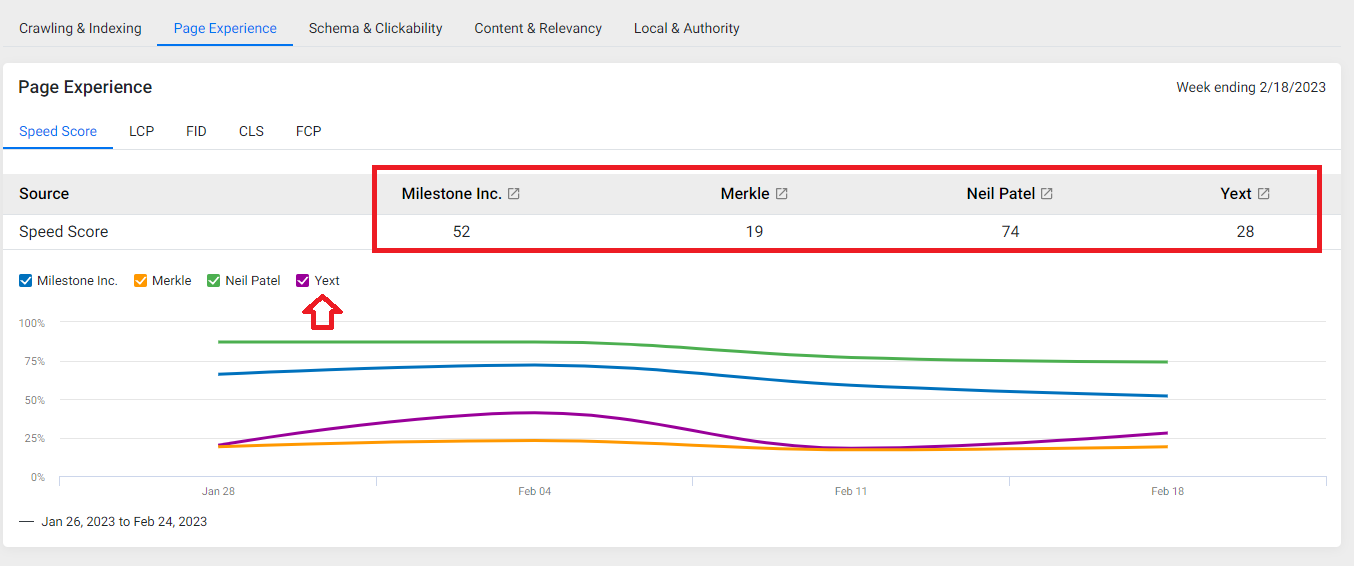
Speed Score: This measures the overall speed of your website. A score of 90 or above is considered good. 50 to 89 is a score that needs improvement, and below 50 is considered poor. This section displays your speed score against your competitors and similarly, this is displayed on the trend graph. You can choose to enable or disable the speed score trend of any of your competitors using the button against the name,
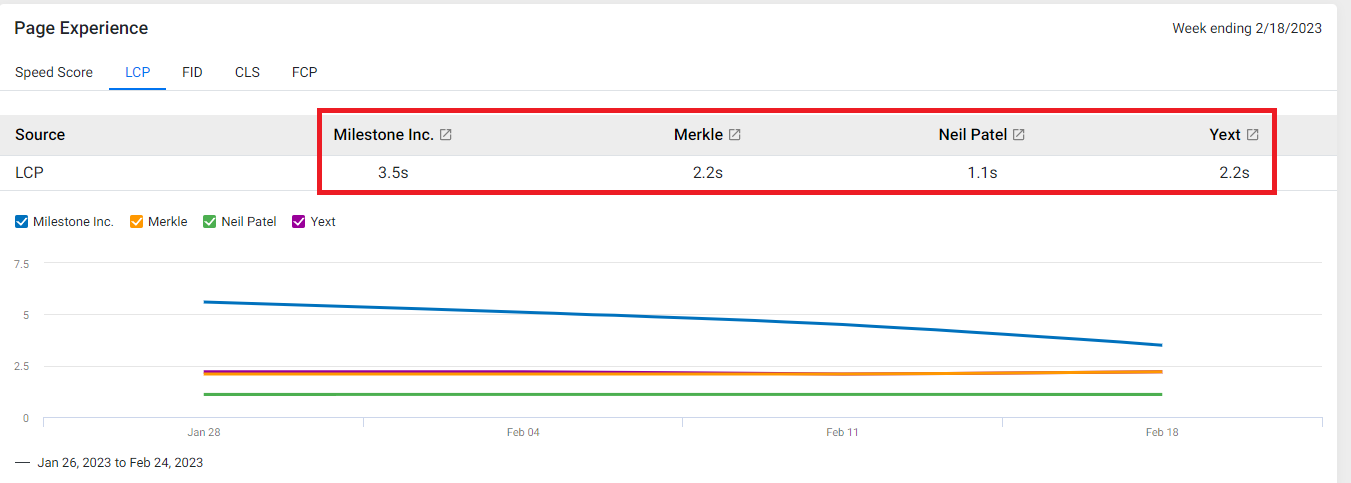
LCP: Measures loading performance. To provide a good user experience, strive to have LCP occur within the first 2.5 seconds of the page starting to load.
To the top of this visualization, you can see the LCP time in seconds under the company's name.
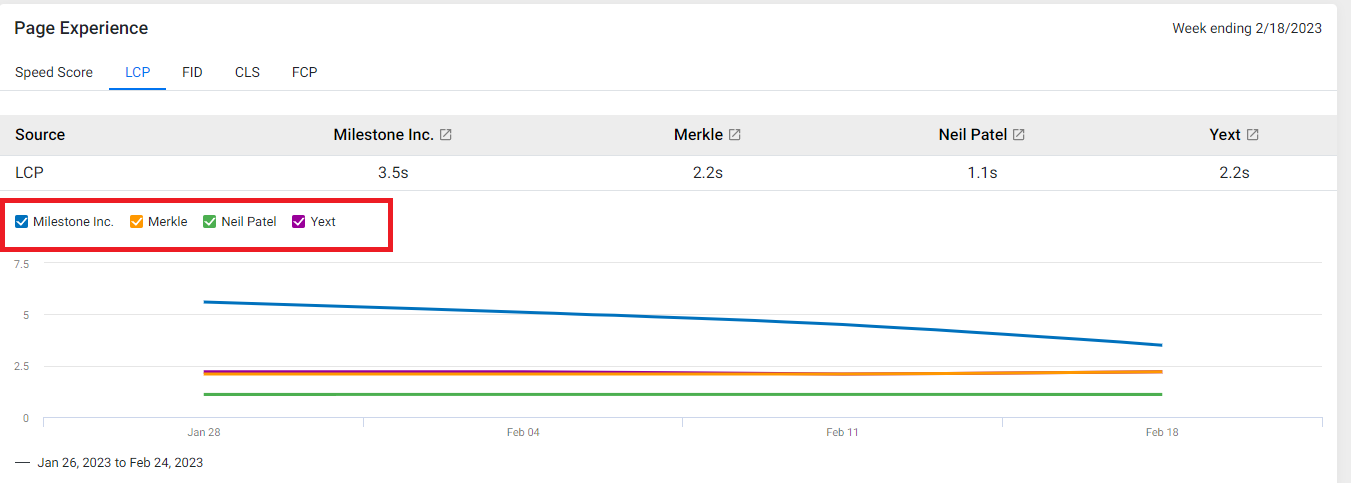
You can also remove competitors from the visualization by clicking on the respective checkboxes to the top of the visualization table
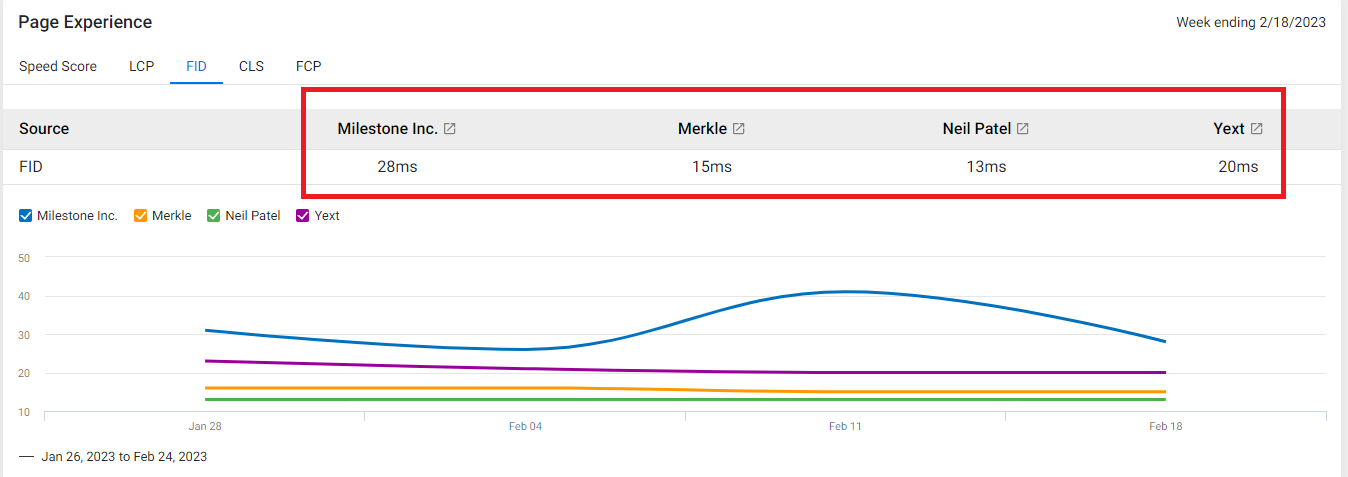
FID: First Input Delay (FID): Measures interactivity or the amount of time before a user can start interacting with elements on the page. To provide a good user experience, strive to have an FID of less than 100 milliseconds.
The comparative FID times are provided to the top of the visualization in milliseconds.
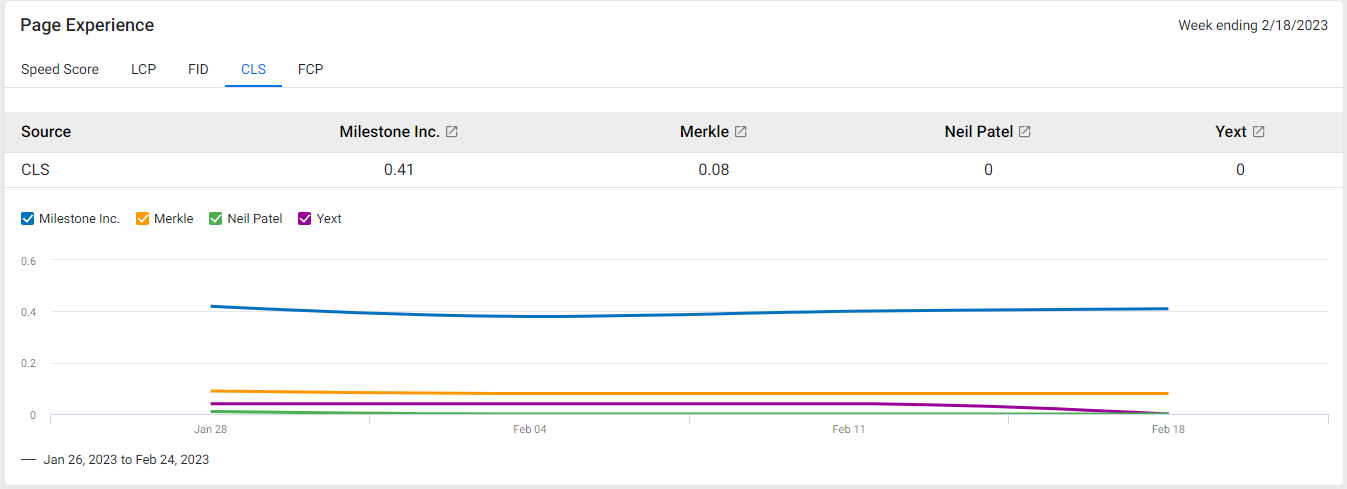
CLS: Cumulative Layout Shift (CLS) measures the visual stability of a webpage. It denotes the total shift of web elements once the page is loaded.
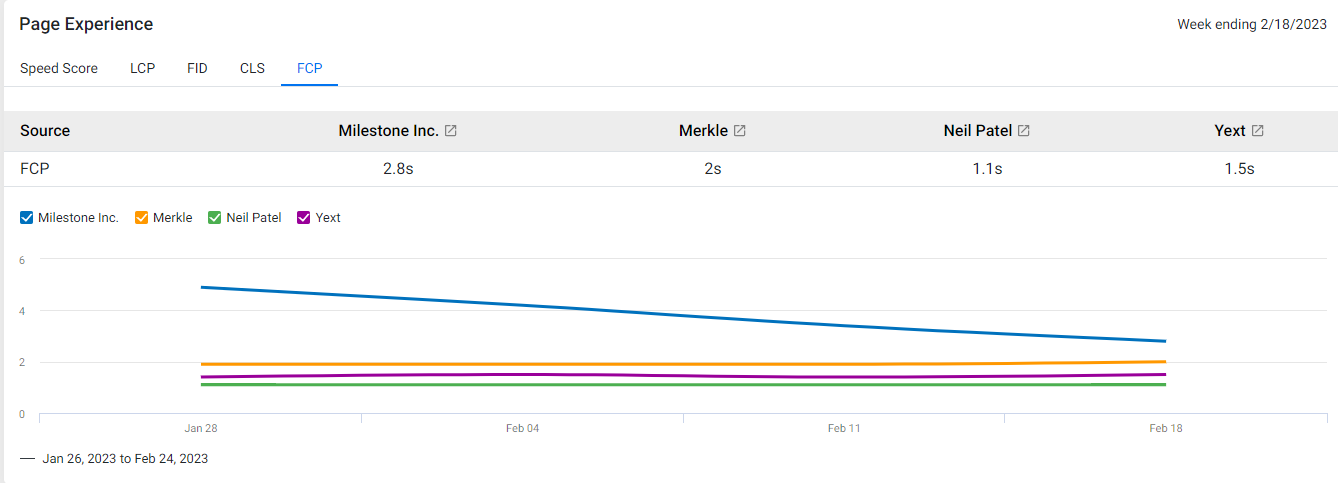
FCP: The First Contentful Paint (FCP) metric measures when the page starts loading to when any part of the page's content is rendered on the screen.
Schema & Clickability
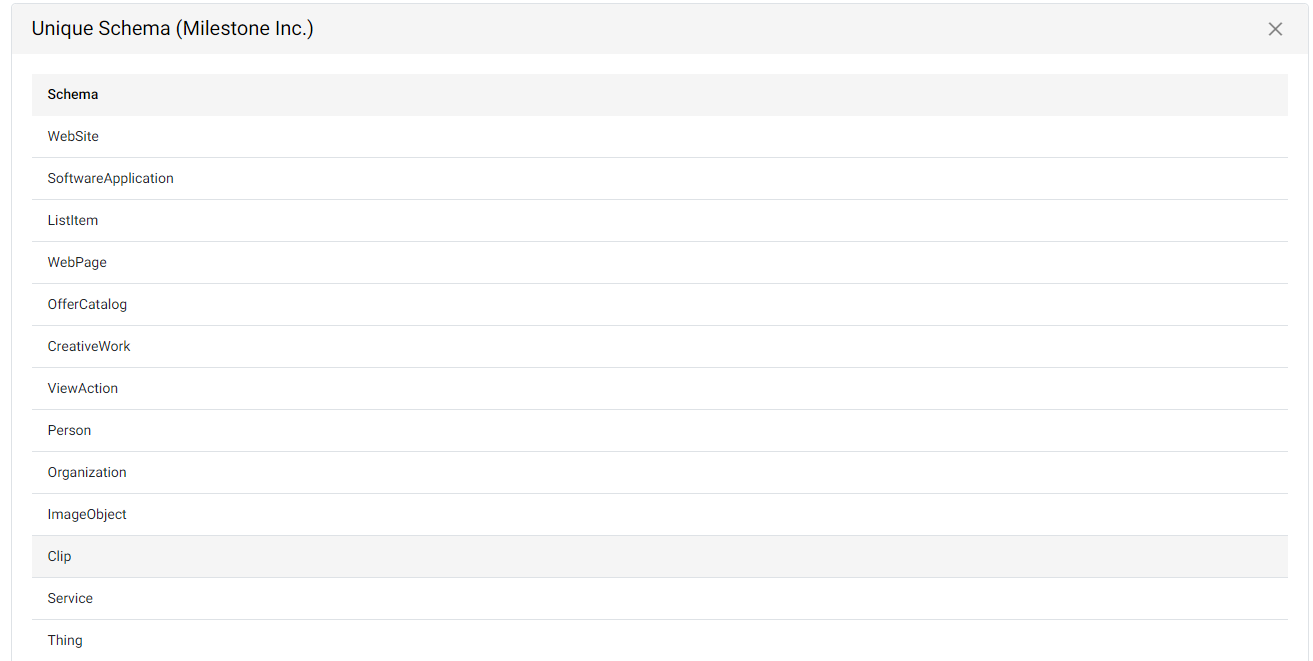
The Schema & Clickability section allows you to view the number of unique schemas deployed on your pages versus those of your competitors.
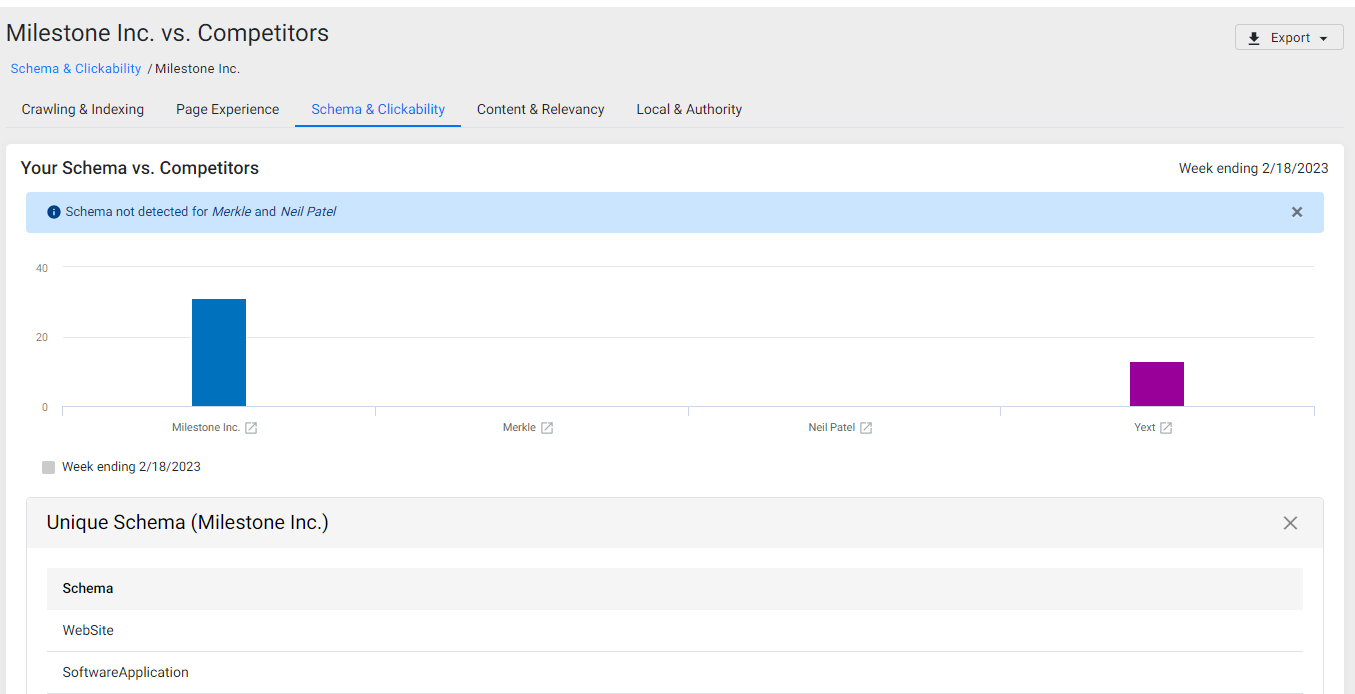
By clicking on the chart you can cycle through the unique schemas deployed on your and competitors’ pages in the list below.
Content and Relevancy
The Content & Relevancy section displays your web pages' performance for organic search and the potential cost savings you have incurred because of appearing organically on search using schema implementation instead of using paid campaigns to improve visibility. There are 2 widgets in this section - Visibility footprint and Channel breakdown.
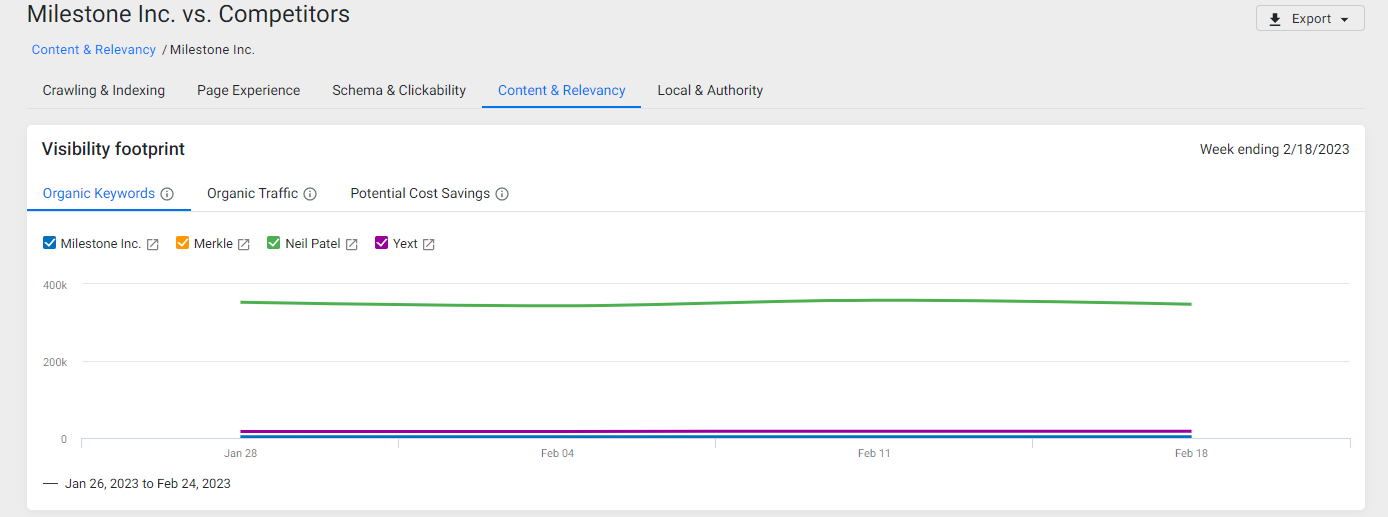
1. Visibility Footprint
Here you can view your organic keywords, organic traffic, and potential cost savings.
Organic Keywords
The Organic Keywords section of the Visibility Footprintchart displays the trend graph showing the number of times your webpages have appeared for non-branded or organic keywords.
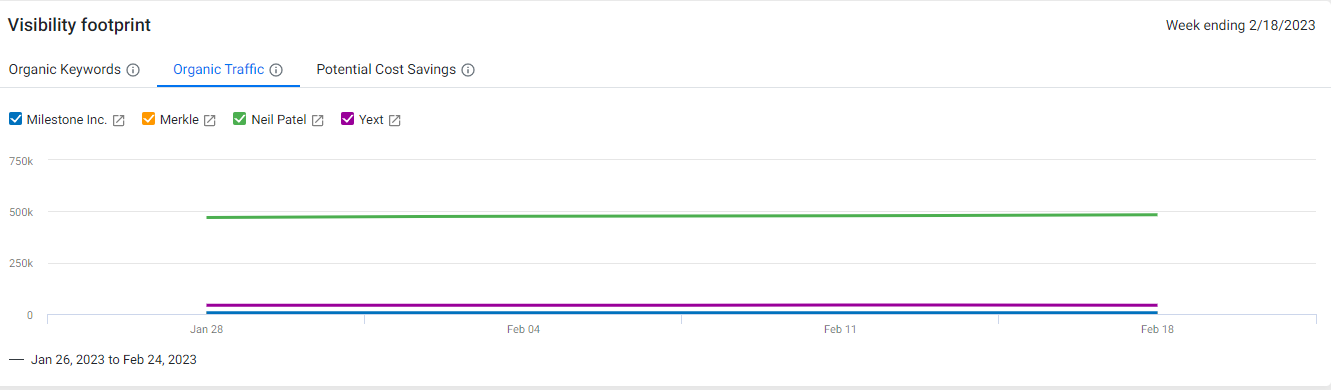
Organic Traffic
The Organic Traffic section shows you the number of visitors that have come to your web pages from non-paid sources. Essentially visitors that have discovered you on a search engine.
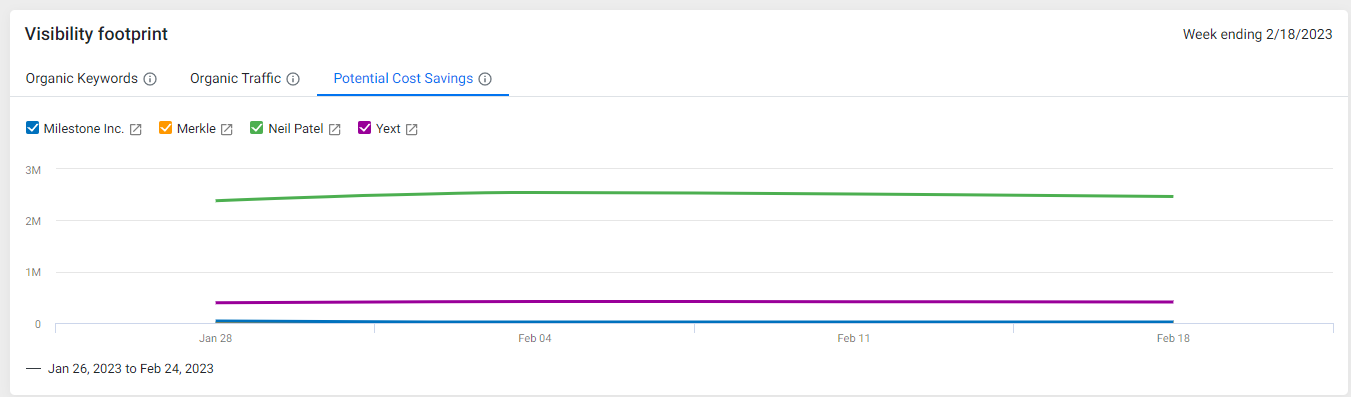
Potential Cost Savings
The Potential Cost Savings trend graph displays the cost savings you have incurred because of appearing organically on search using schema implementation instead of using paid campaigns to improve visibility.
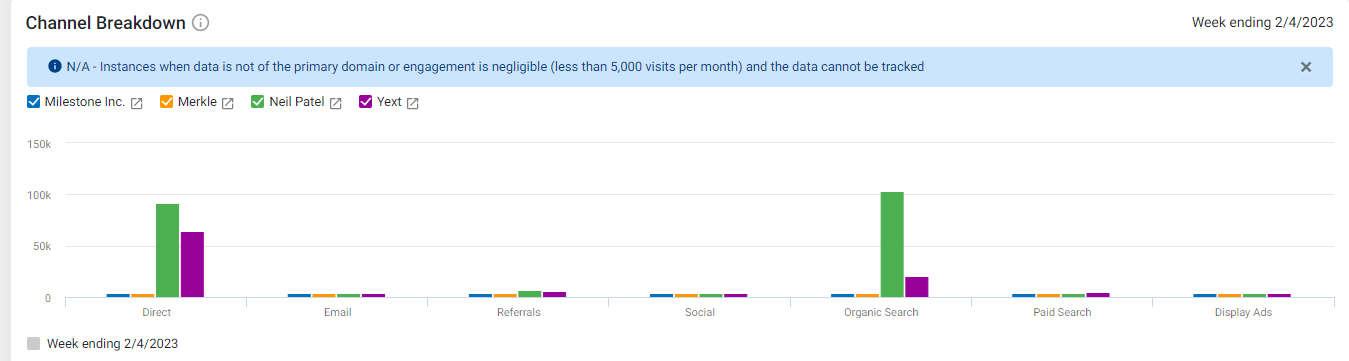
2. Channel Breakdown
The Channel Breakdown section displays the channels through which you and your competitors are being discovered online. These channels are Direct channels, Email, Referrals, Social, Organic Search, Paid search, and display ads.
Local and Authority
The Local Authority section has 3 widgets that determine the penetration and visibility of your business in the local ecosystem - Site Authority, Local Authority, and Social Engagement.
Site Authority
The Site Authority section of the Local & Authority tab displays the overall site authority of your website by determining the domain authority, the number of incoming links and the number of follow vs no follow requests.
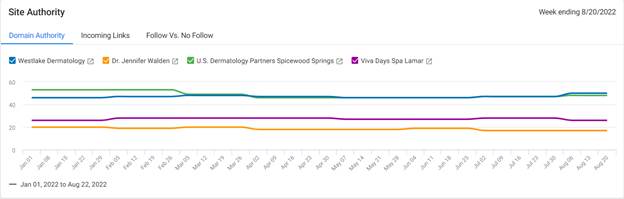
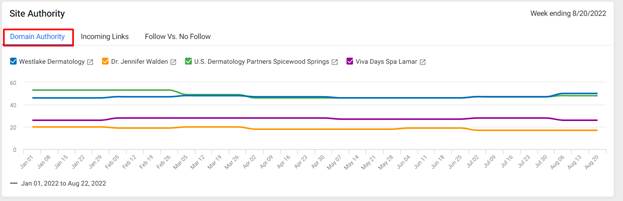
Domain Authority
The domain authority tab displays your relative domain authority against your competitors.
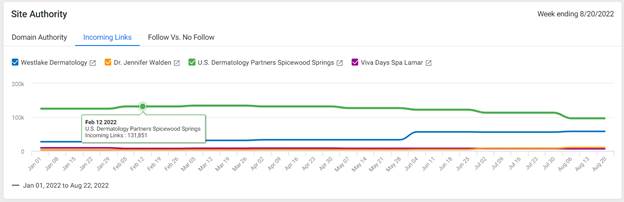
Incoming Links
The Incoming Links section shows you a comparative view of how many third-party websites point to one of your web pages Vs. those of your competitors.
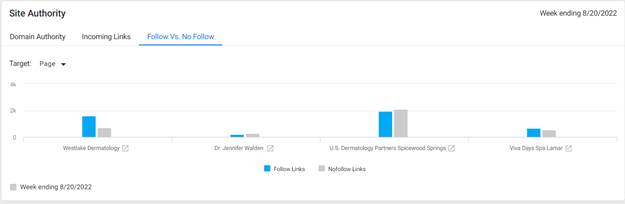
Follow vs No Follow
The Follow vs No Follow section shows the number of times your websites have been tagged as no follow vs follow by third-party websites. This tells search engines to not follow the tagged link.
Local Authority
The Local Authority section establishes the overall accuracy and authority of your local listings across channels.
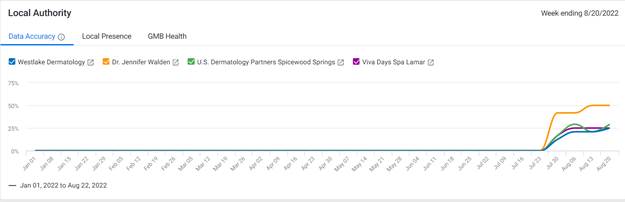
Data Accuracy
The Data Accuracy tab in the local authority section displays the percentage accuracy of your listings across directories versus those of your competitors
Local Presence
The Local Presence tab displays the channels you and your competitor's local listings are complete, incomplete, and not present.
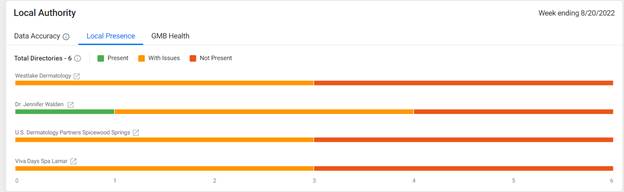
Green denotes the channels that you and your competitor share a presence on. Amber denotes the presence of a local listing, but the listing is either incomplete or facing problems. Red denotes the absence of local listing on the given channels. You can view the local channels by hovering over the bar.
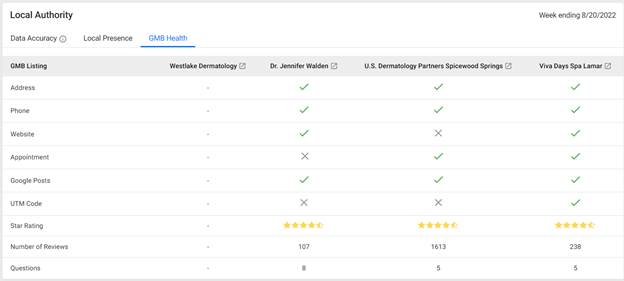
GMB Health
The GMB Health tab displays a comparative view of elements that are present or missing from your and your competitors’ Google Business Profile.
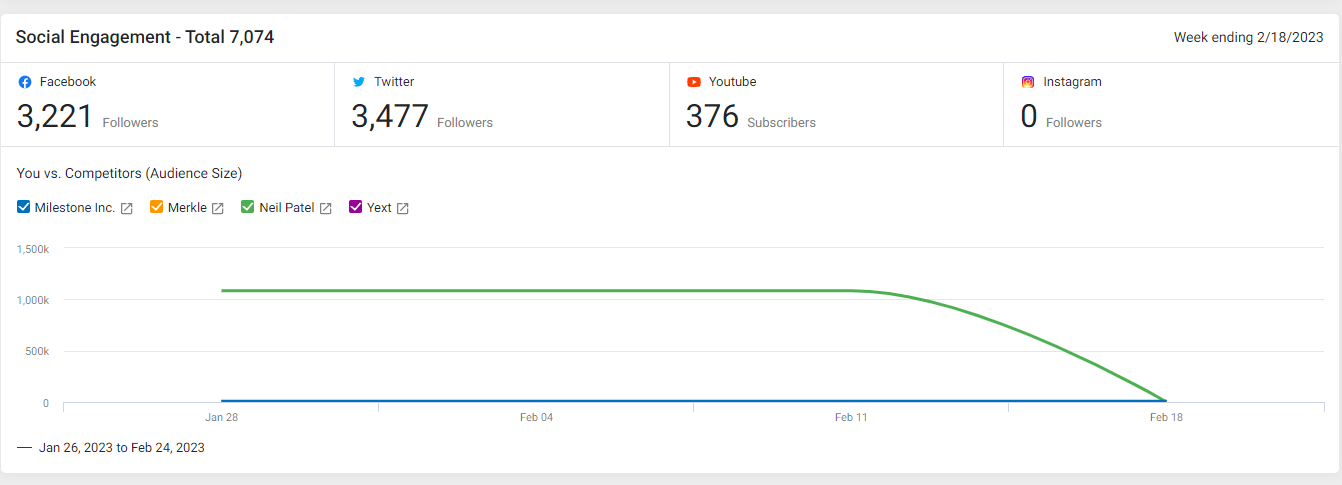
Social Engagement
The social engagement displays your social engagement across top channels such as Facebook, Twitter, YouTube, and Instagram.