Schema & Clickability
The Schema and Clickability section allows you to view the status of the schemas deployed across your website.
Schema Audit
The Schema Audit tab of the Schema and Clickability section allows you to view all the website schemas deployed. By clicking on the ‘Read More’ column corresponding to a webpage you can view the schema types deployed on that webpage.
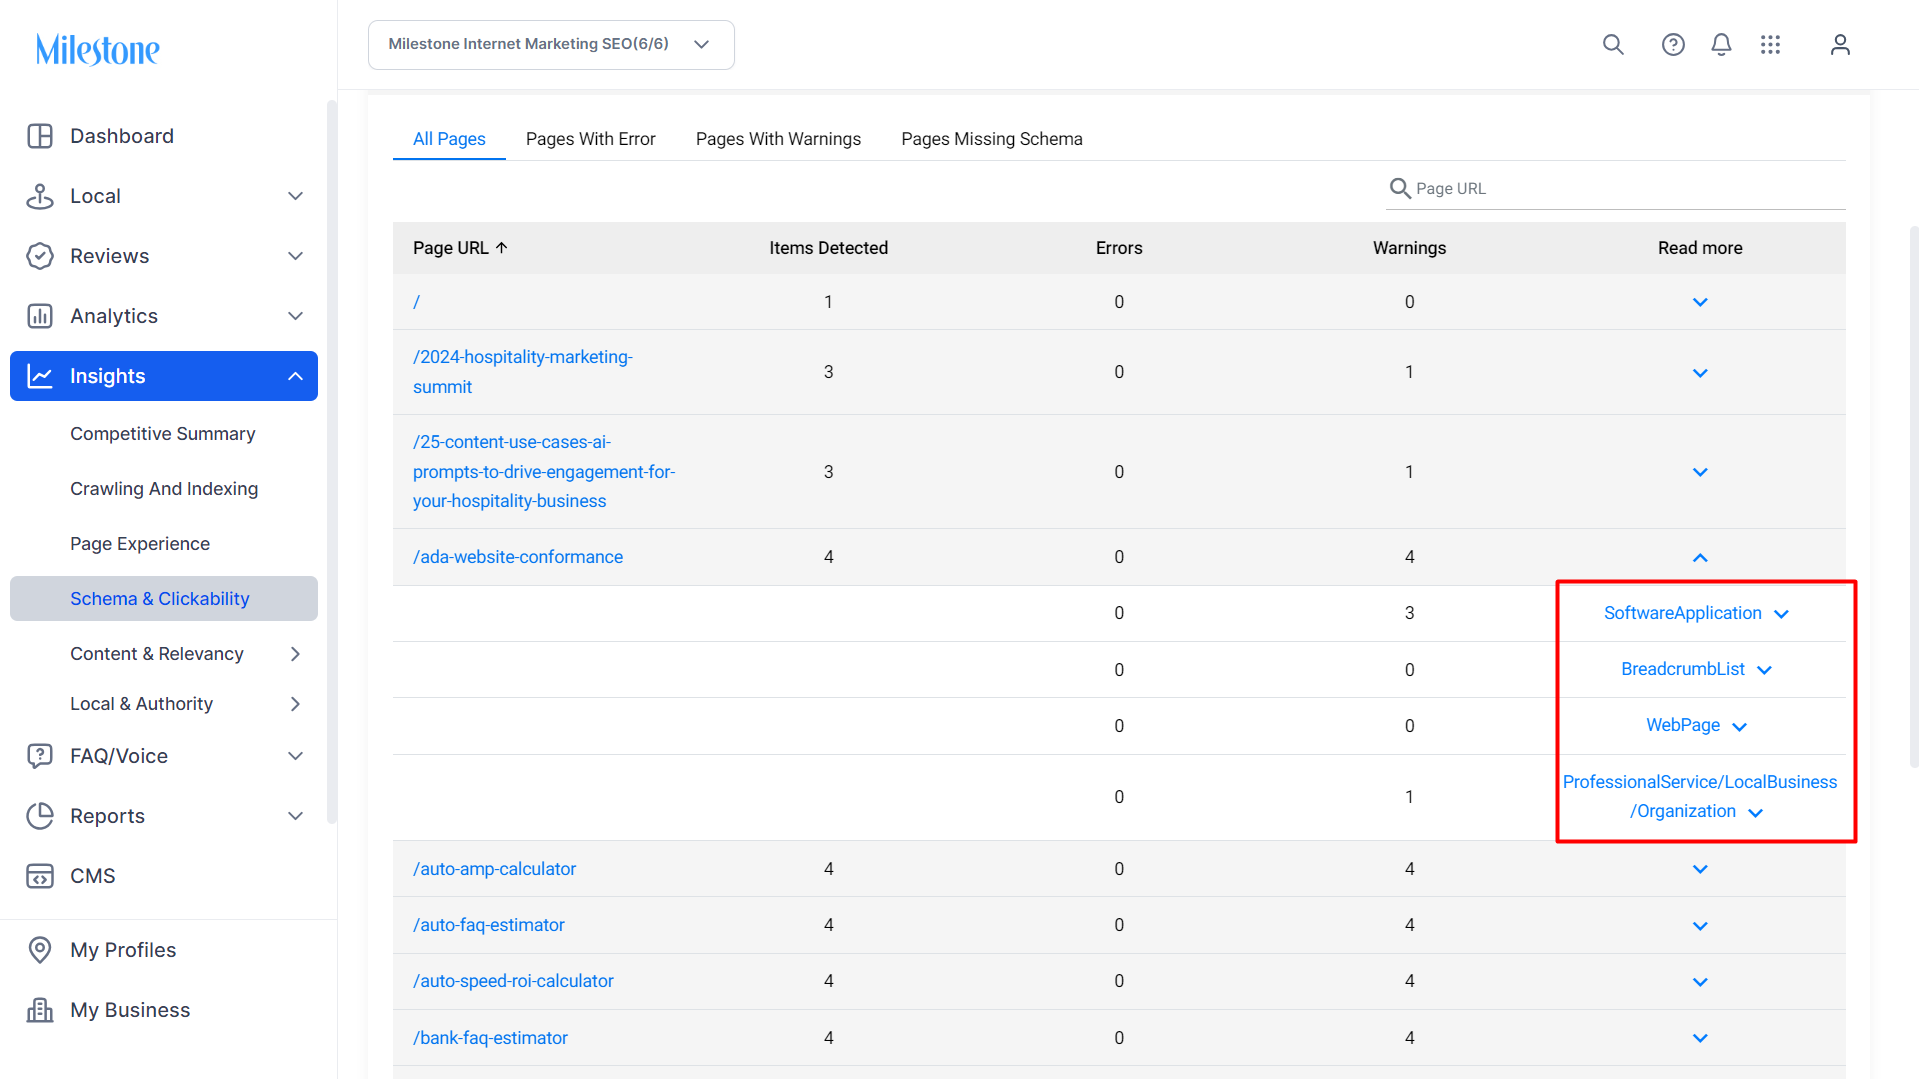
By further click on a specific schema type deployed you canview the details of the schema and where on the page it has been deployed
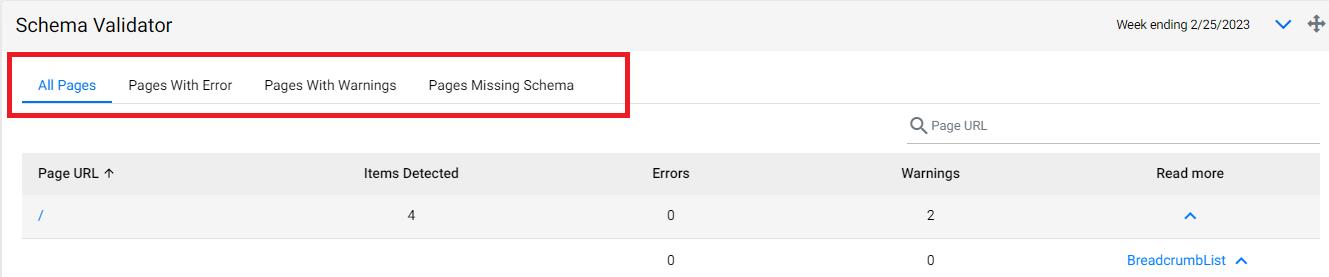
By Toggling through the tabs to the top of this chart you can view all pages, pages that have schema errors, pages that have warnings - basically pages with content opportunities, and pages that have missing schema.
You can use the search bar and enter a keyword to look for specific webpages.
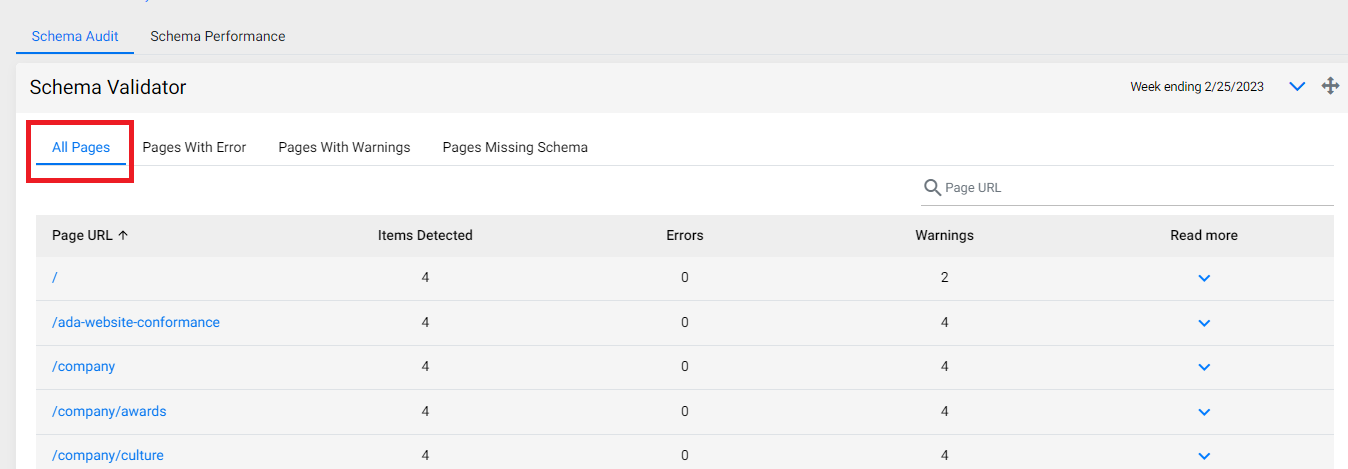
All Pages
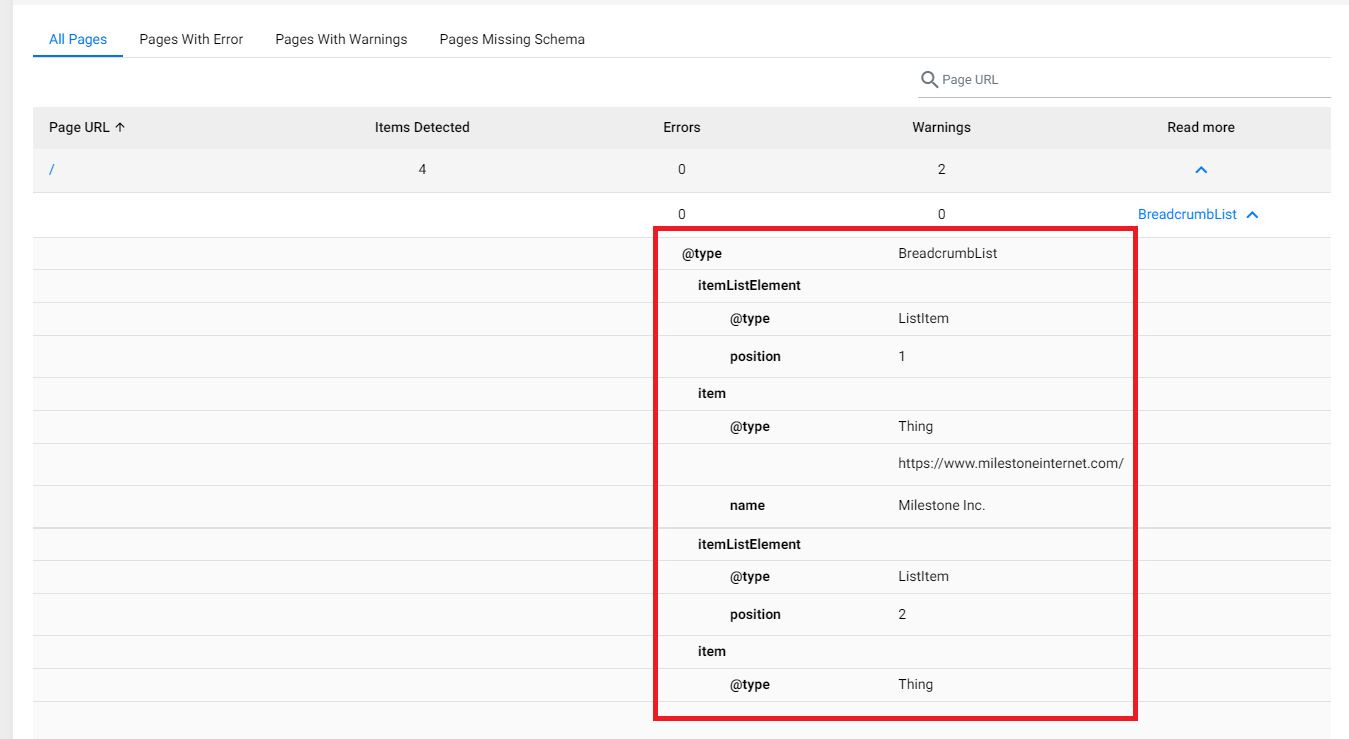
The 'All Pages' section gives you a comprehensive view of your URLs, schema detected under 'Items Detected', and the number of schema errors and warnings. The 'Read More' as mentioned will display the schema in detail.
Pages with Error
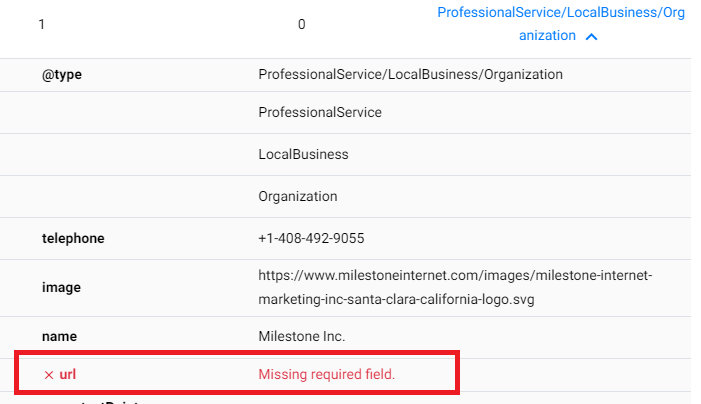
This section only displays the URLs with schema errors. To identify the errors, click on the schema type with the error under the 'Read More' Column.

You will see the reason why the error is propping up. In this case, it is because of a missing URL.
Pages with Warnings
Here, you will see pages with warnings. Click on the schema type under the "Read More' column with the warning against it to view the warning or 'content opportunity'.

You will see the warning or recommendation to add a property.

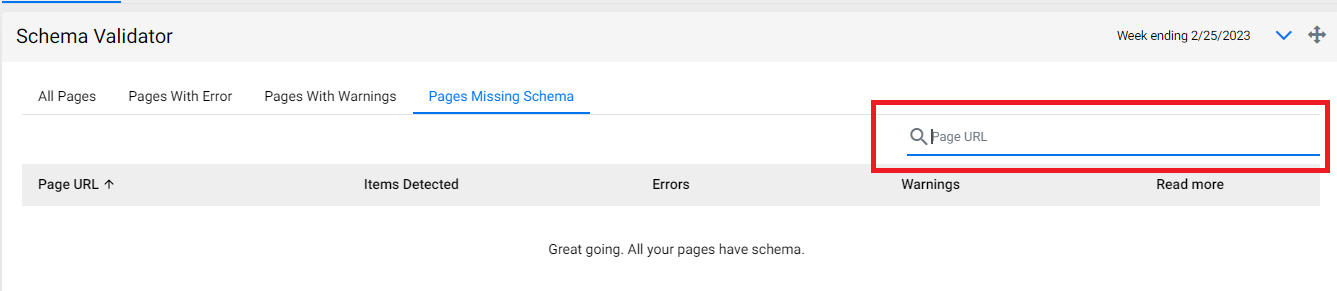
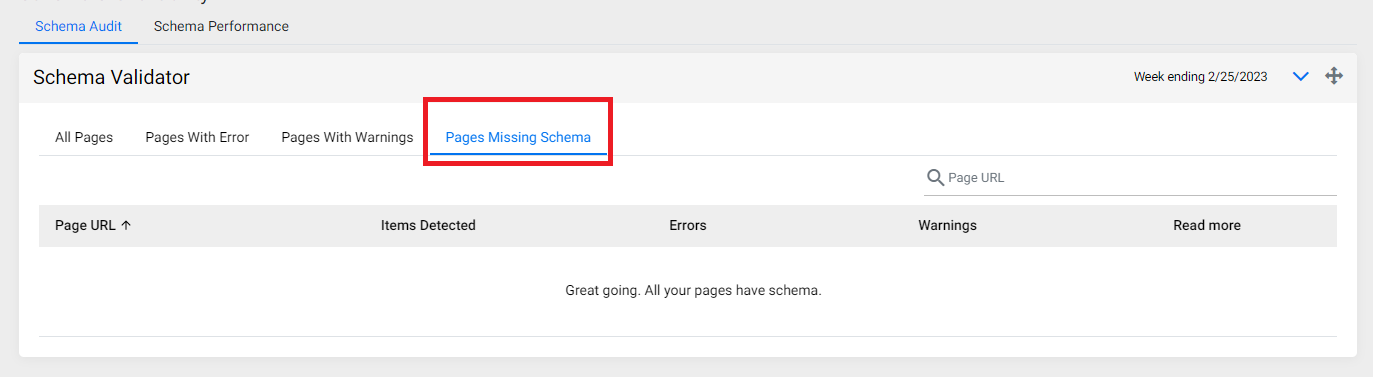
Pages missing Schema
This section will display the URLs without any schema. In this case, all the pages have schema.
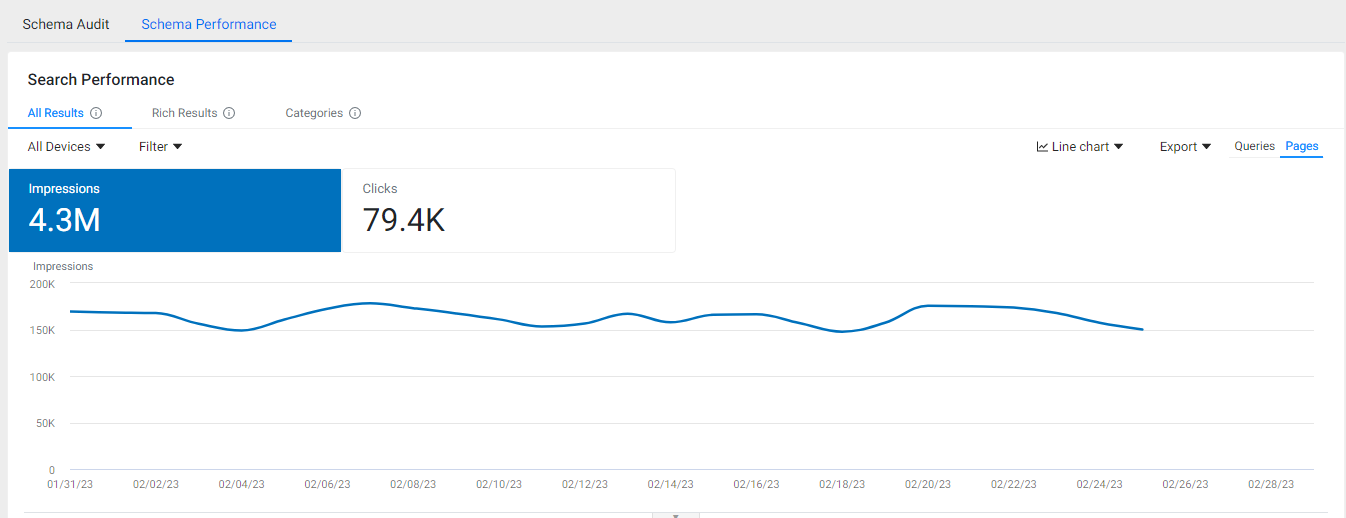
Schema Performance
The Schema Performance tab displays the performance of webpages that have schema deployed on them in terms of clicks and impressions.
The Click and Impressions For Search Queries displays a trend graph for clicks and impressions across devices.
You can filter click and impressions across devices by using the drop-down menu.
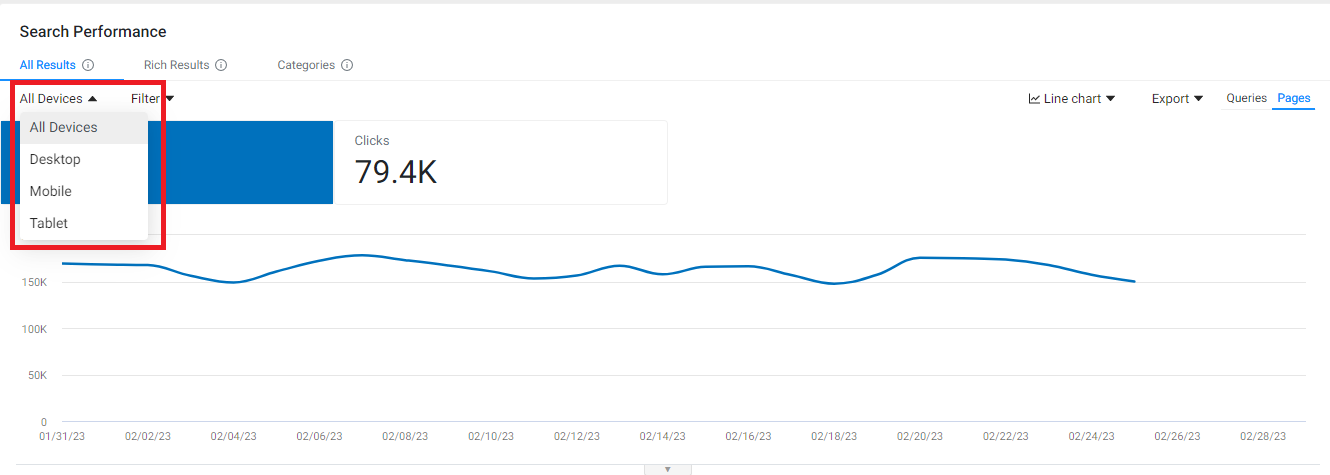
You can also use the filters to narrow down your search.

On the right, use the drop-down to choose your chart type.

Wish to download your performance, click on 'Export' and click on 'Schedule'.

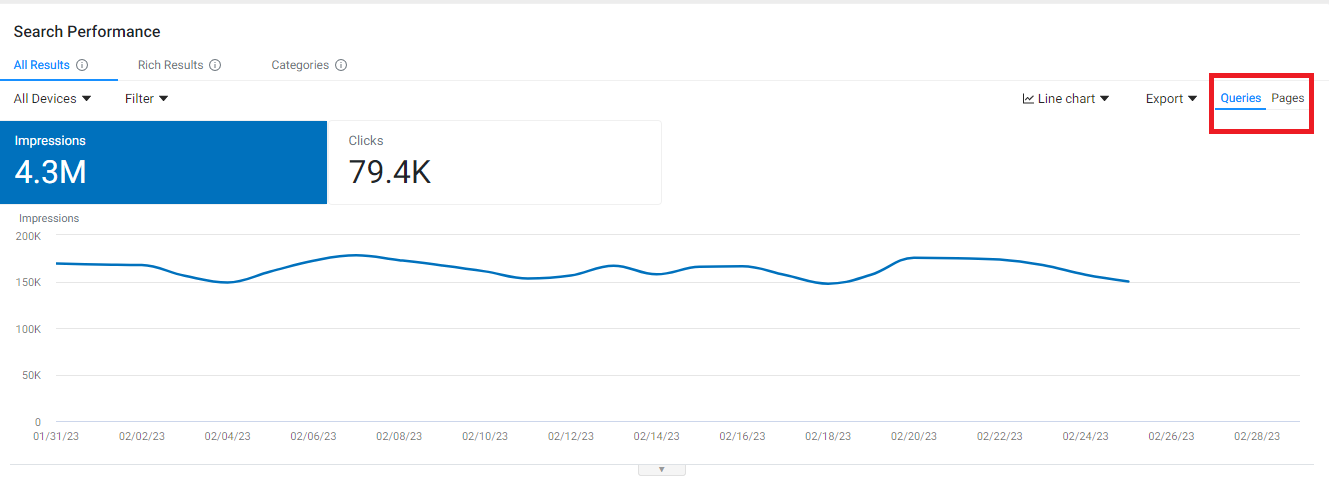
Using the toggle, you can view your data by search queries or pages (URLs).
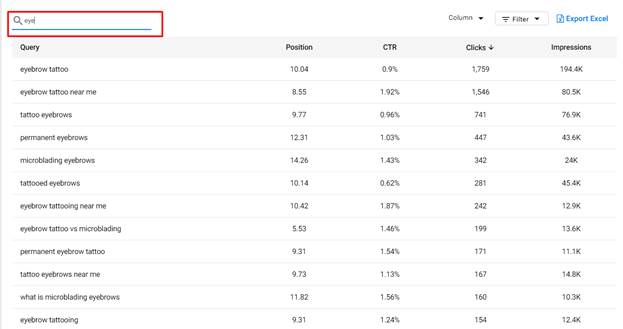
Below the trend graph, you will see the performance of your queries.

You can use keywords in the search bar to the top of the chart to view performance data for specific queries
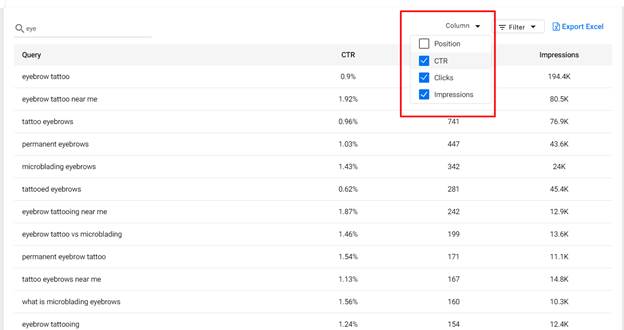
You can add or remove columns for this chart using the 'columns' drop-down menu.
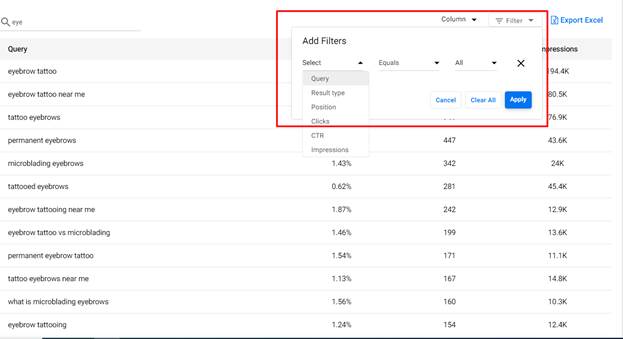
You can slice and dice the data in this chart using a variety of filters from the filters drop-down menu
All Results
The 'All Results' section displays your schema performance across all pages. View the performance by clicks and impressions on the trend graph.
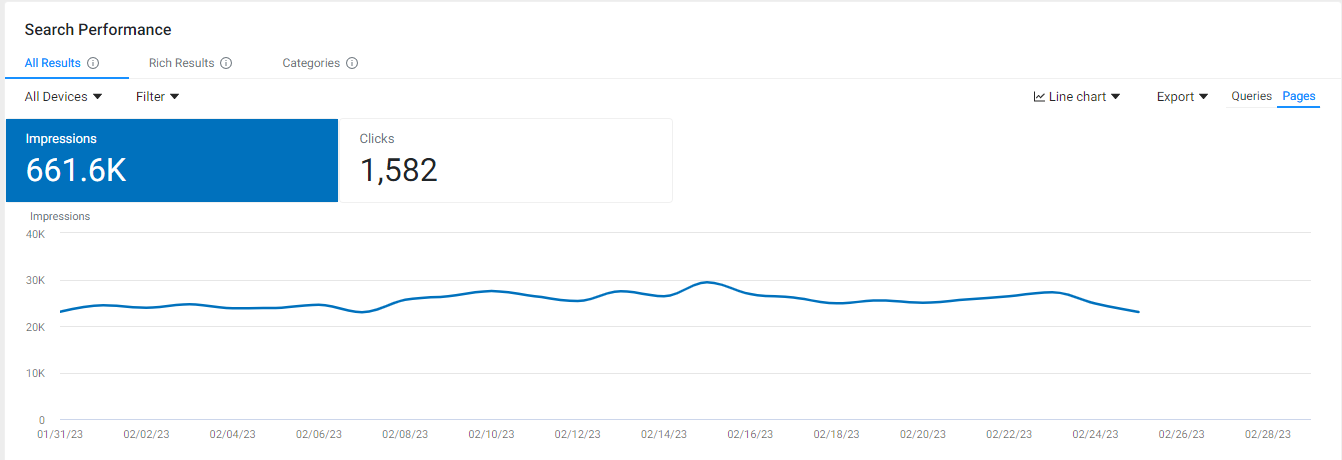
Further down, you can view the performance of each page by search position, clicks, impressions, and CTR.

Rich Results
The Rich Results section will display the performance of your rich results in clicks and impressions on the trend graph.
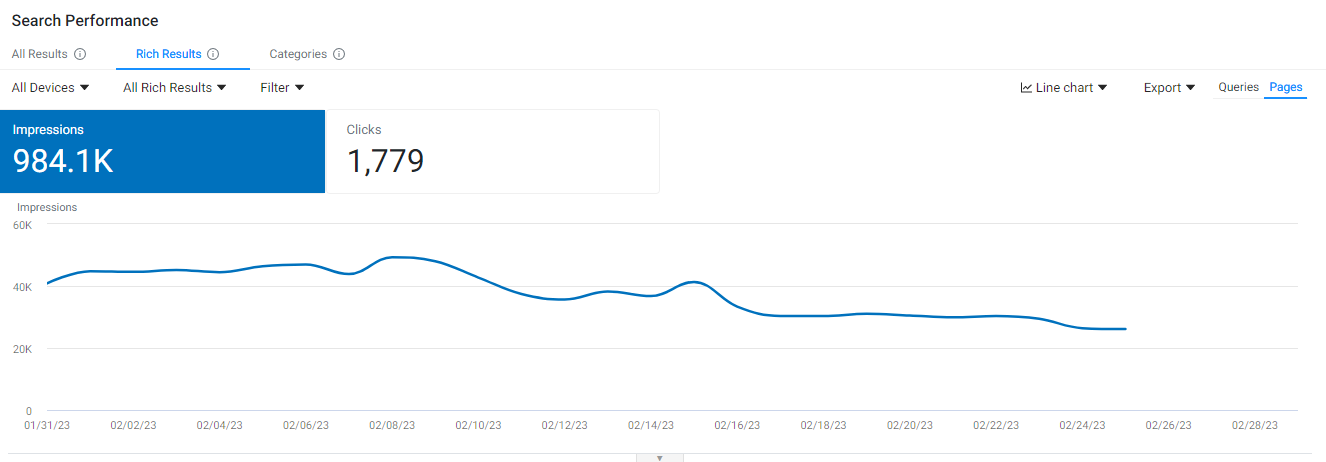
Scroll down to view the rich result performance for each URL, the schema categories used on each page, and the search position, clicks, impressions, and CTR.

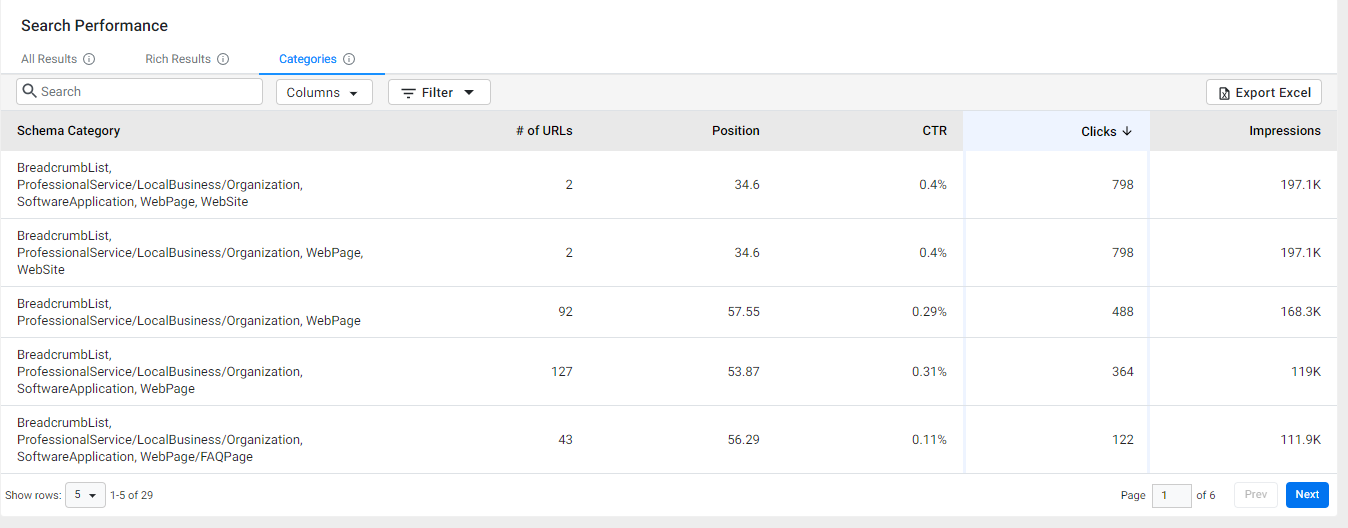
Categories
The Categories section shows your top-performing schema categories across web pages. This will give you an insight into which categories are working best and which are not.