Holiday Banner Analytics
Milestone Analytics’ Holiday Banner feature allows you to view up to 7 Key Performance Indicators (KPIs) for your Holiday ads. To improve the overall user experience, we made a change by converting the scorecard view to a chart view.
Path: MPC > Analytics > Website Performance > Holiday Banner
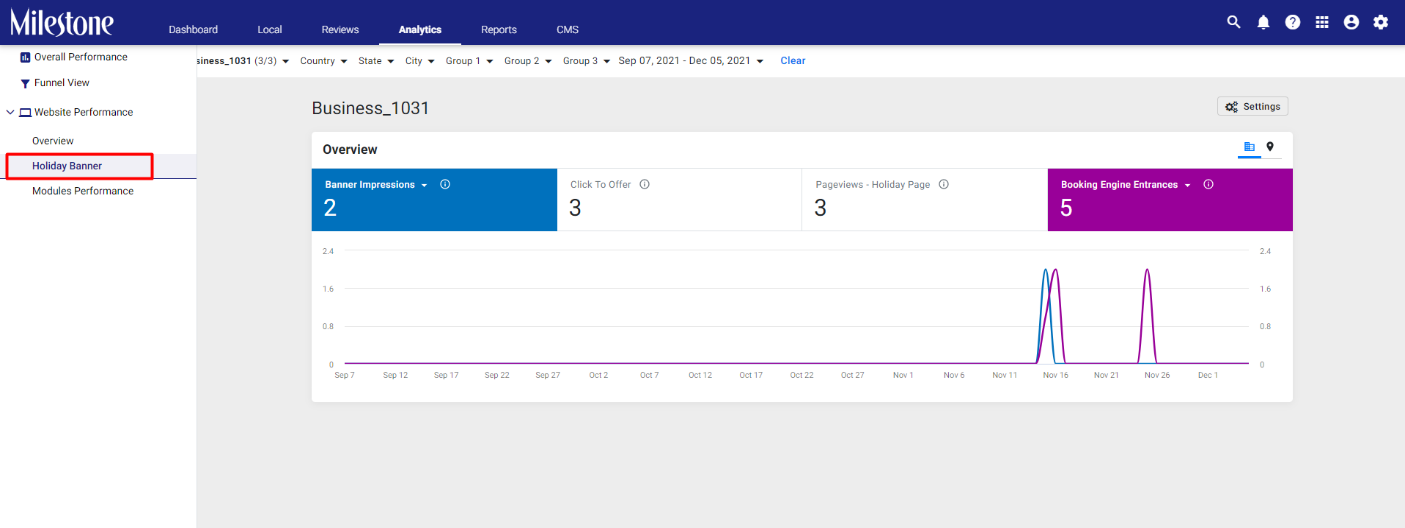
Step 1: In the left navigation panel of the Analytics section click on ‘Holiday Banner’ under ‘Website Performance’
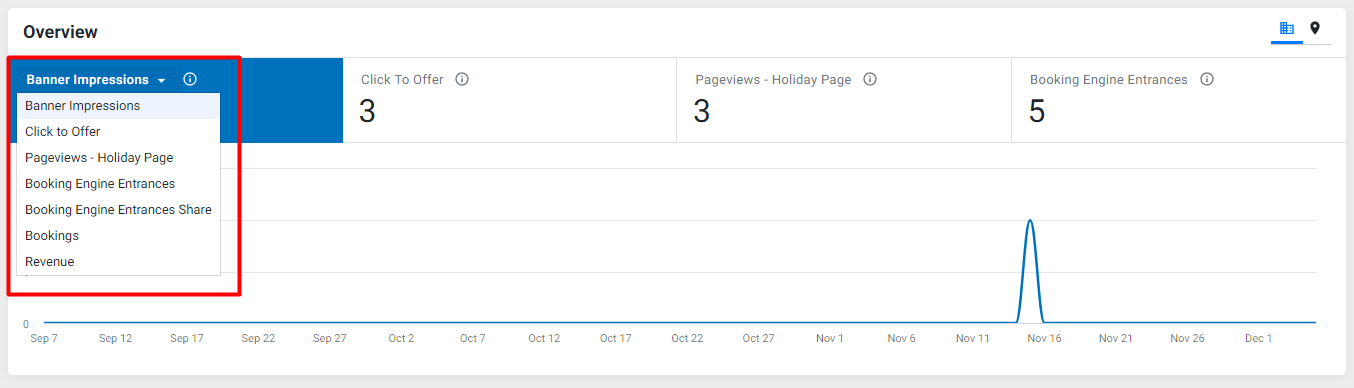
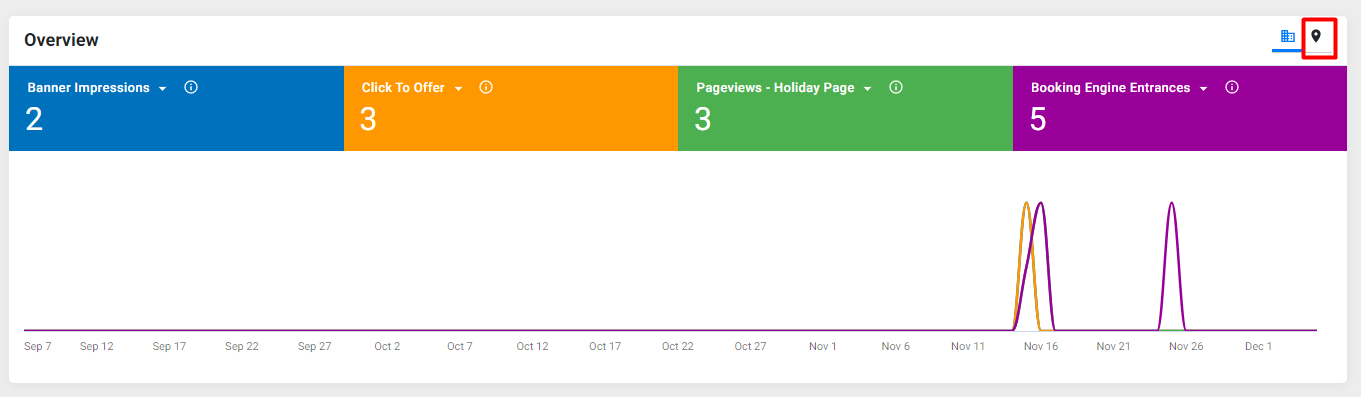
Step 2: Click on the dropdown menu in one of the data tiles and select the KPI you wish to view in the trend graph
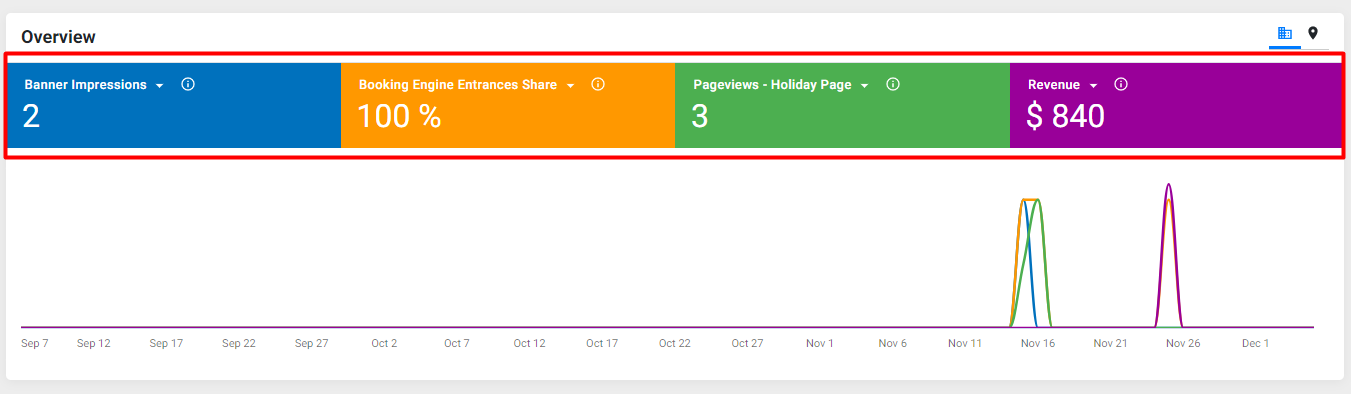
Step 3: You can view multiple KPIs on the same trend graph by selecting or deselecting a data tile
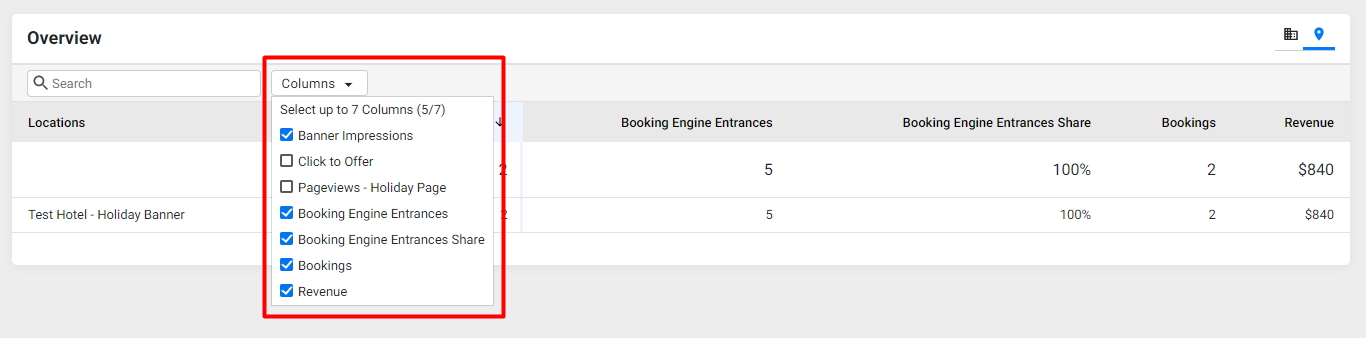
You can also select profile view (tabular data) for Holiday Banners across all locations by clicking on the 'Profile view Icon’ at the top right of the screen
In the 'Profile view, you can select or deselect data columns using the dropdown menu to the right of the search bar