Release Aug 23, 2024
Analytics
AB Testing Reports
Previously, A/B Tests could be created within the CMS, but reporting had to be handled manually, with no straightforward way to configure or access A/B Test reports. To address this, a new report configuration feature was introduced in the CMS, allowing users to configure and view A/B Test reports directly within the CMS and MPC. The goal was to streamline the process by making A/B Test report configuration and access easily available on both platforms.
You can view the results of the A/B test for personalized content in the ‘Website Performance’ section of Milestone Analytics.
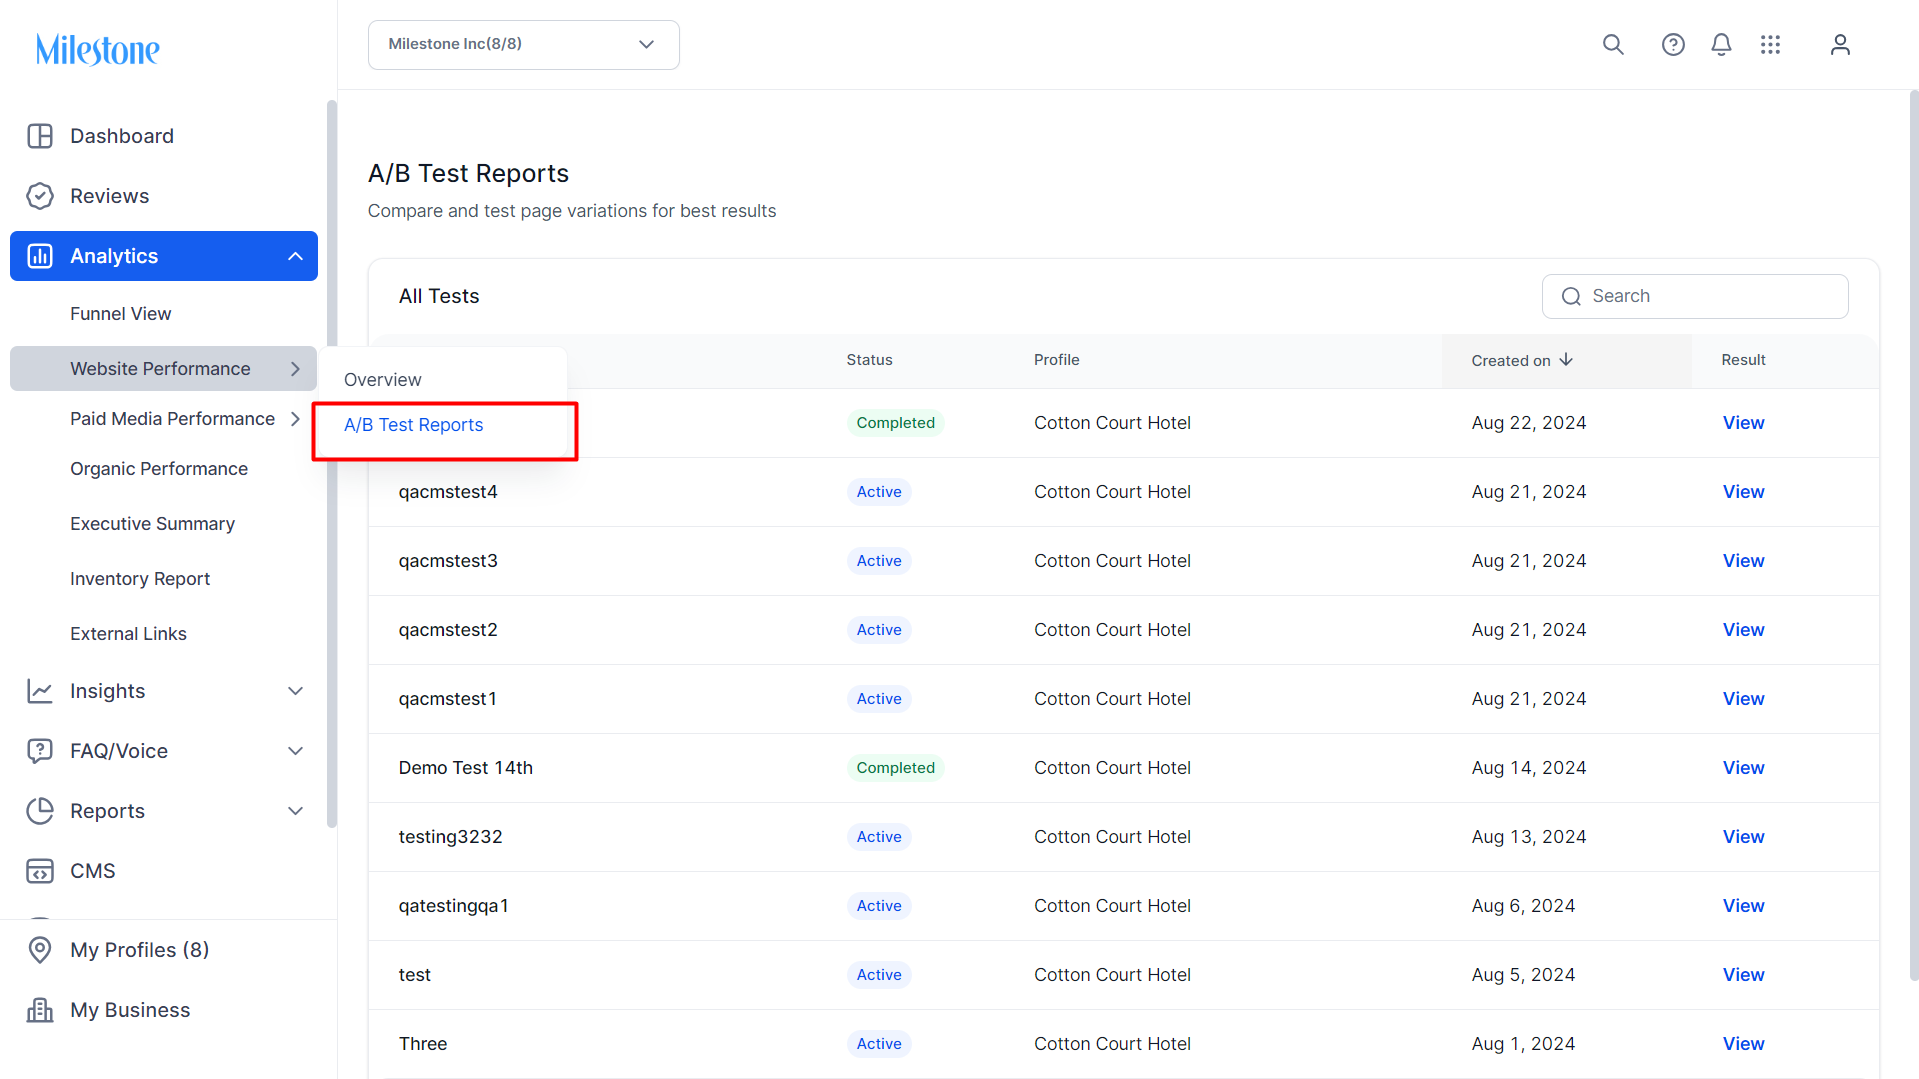
In this section you can view all the A/B Tests that have been created for the profile. You can view the test names, the status of the test, the profile they have been created for, the date the test was created and the results.
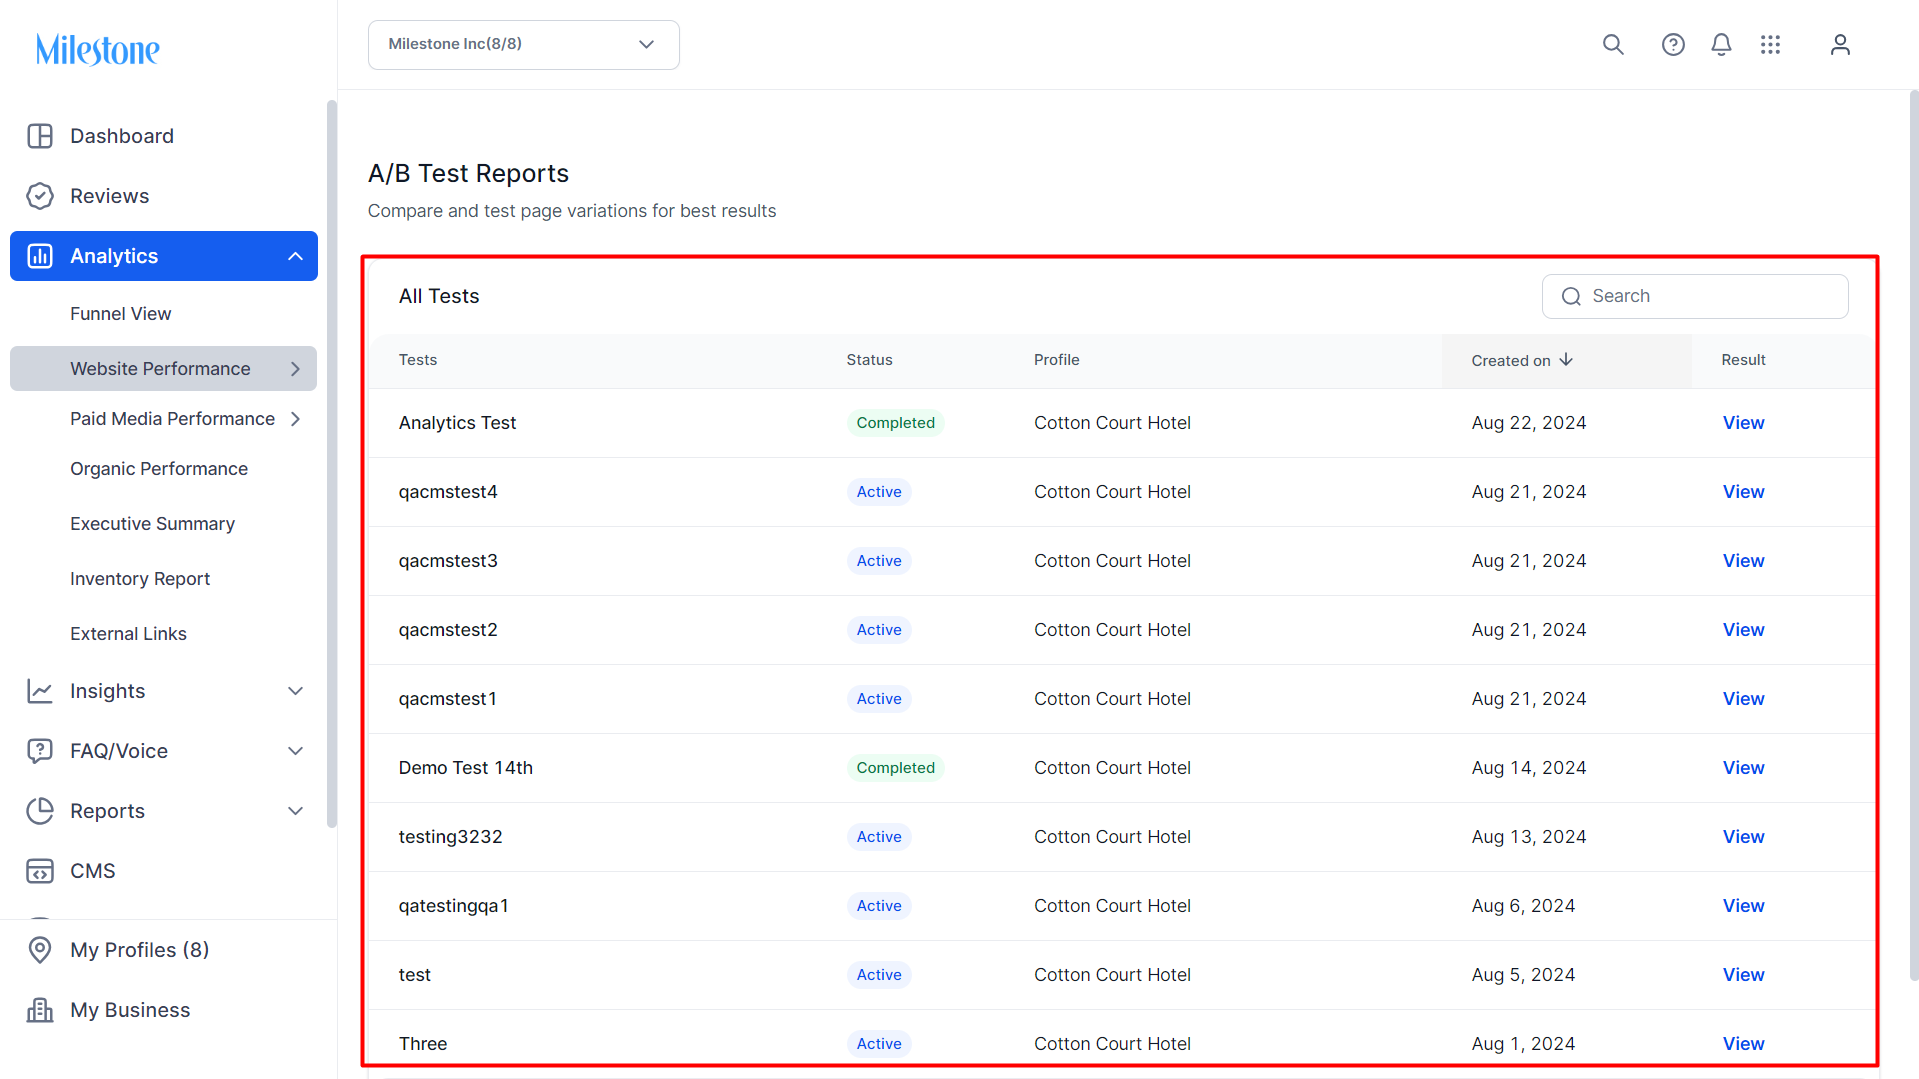
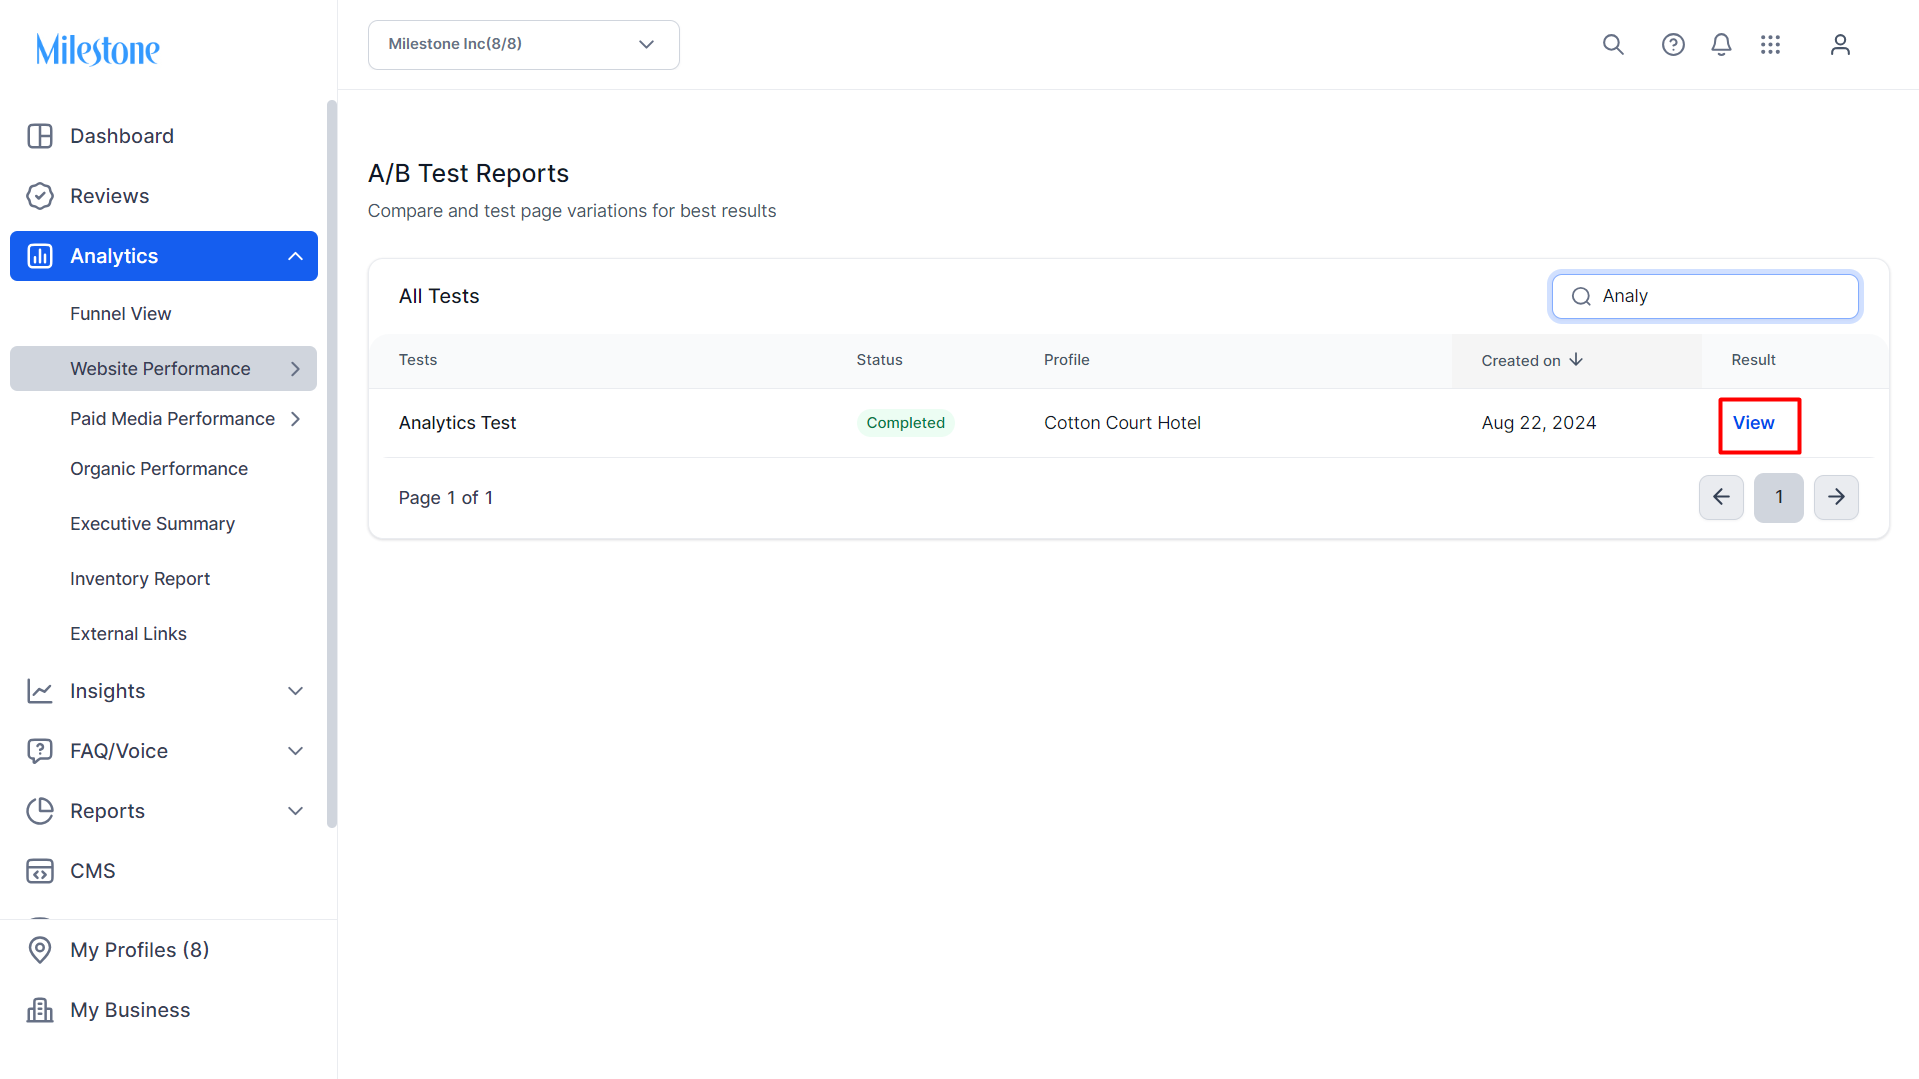
Use the search bar at the top right to search for a specific test that has been created.

To view the results of the test click on ‘View’ in the ‘Results’ column.
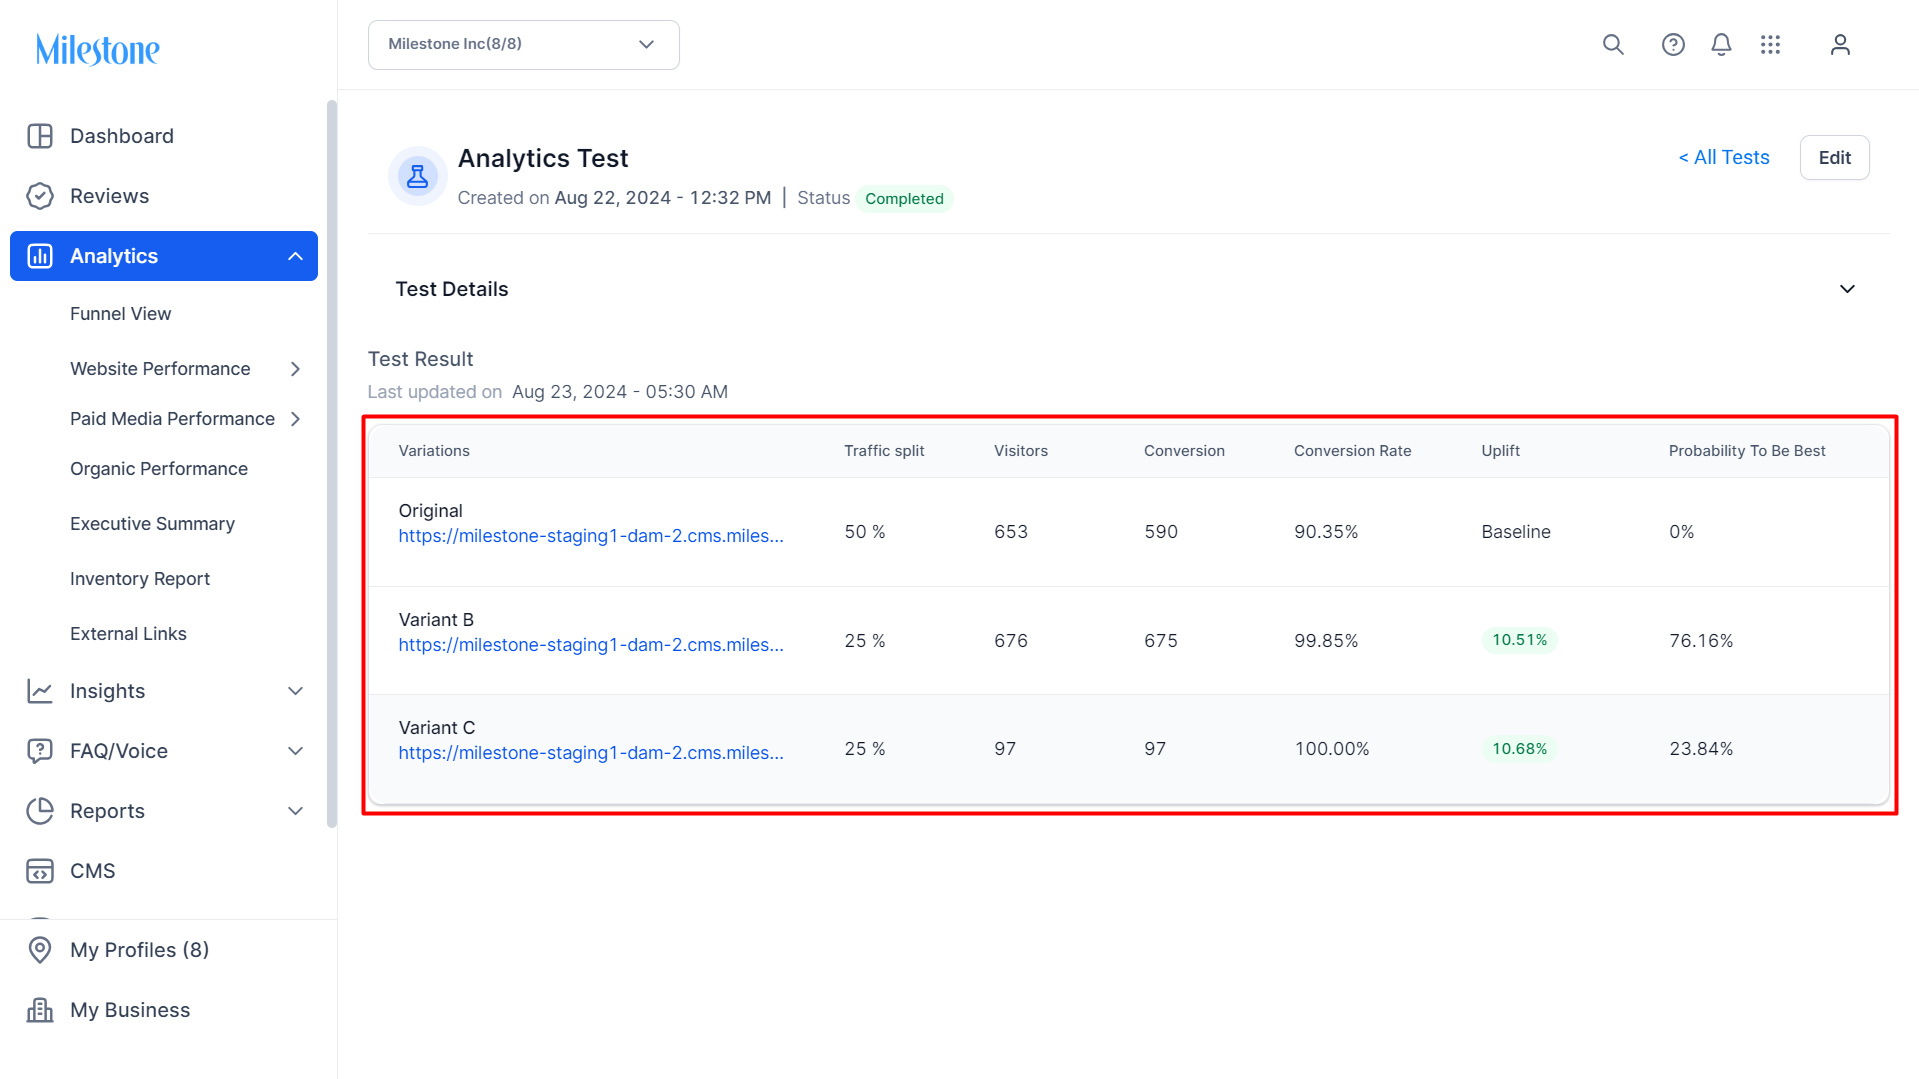
The ‘A/B Test Reports’ section displays the results of the test. The test results are calculated across 5 metrics.
Traffic Split: 'Traffic Split' refers to the distribution of user traffic between different variations of a webpage or experience. When conducting an A/B test, the total incoming traffic is divided into different segments, with each segment being directed to a specific version of the page (e.g., Version A or Version B). The traffic split can be equal (e.g., 50/50) or uneven (e.g., 70/30) depending on the testing strategy. The purpose of this split is to measure the performance of each variation in a controlled manner, allowing for the comparison of metrics such as conversion rates, engagement, or other key performance indicators (KPIs) to determine which version is more effective for personalization efforts.
Visitors: 'Visitors' refers to the individuals who land on and interact with the different variations of the web pages being tested. Each visitor is randomly assigned to one of the variations (e.g., Version A or Version B) based on the traffic split. The behavior, interactions, and outcomes (such as clicks, conversions, or time spent on the page) of these visitors are tracked and analyzed to determine the effectiveness of each variation in achieving the desired personalization goals.
Conversion: 'Conversion' refers to the specific action that a visitor takes on a webpage that aligns with the desired outcome of the test. This action could vary depending on the goal of the personalization, such as making a purchase, signing up for a newsletter, filling out a form, clicking a specific button, or any other measurable activity that signifies a successful interaction with the webpage.
Conversion Rate: 'Conversion Rate' refers to the percentage of visitors who complete a desired action (or "convert") out of the total number of visitors exposed to a specific variation of a webpage. It is calculated by dividing the number of conversions (e.g., purchases, sign-ups, form submissions) by the total number of visitors and multiplying by 100 to express it as a percentage.
Uplift: 'Uplift' refers to the improvement or increase in a key performance metric, such as conversion rate, that results from implementing a particular variation of a webpage compared to the original version or another variation. Uplift is typically expressed as a percentage and indicates how much more effective the personalized variation is in achieving the desired outcome.
Probability to be best: 'Probability to be Best' is a statistical measure that indicates the likelihood that a particular variation of a webpage is the most effective among all the variations being tested. It is expressed as a percentage and helps to determine which variation is most likely to outperform the others in achieving the desired outcomes, such as conversions or user engagement.
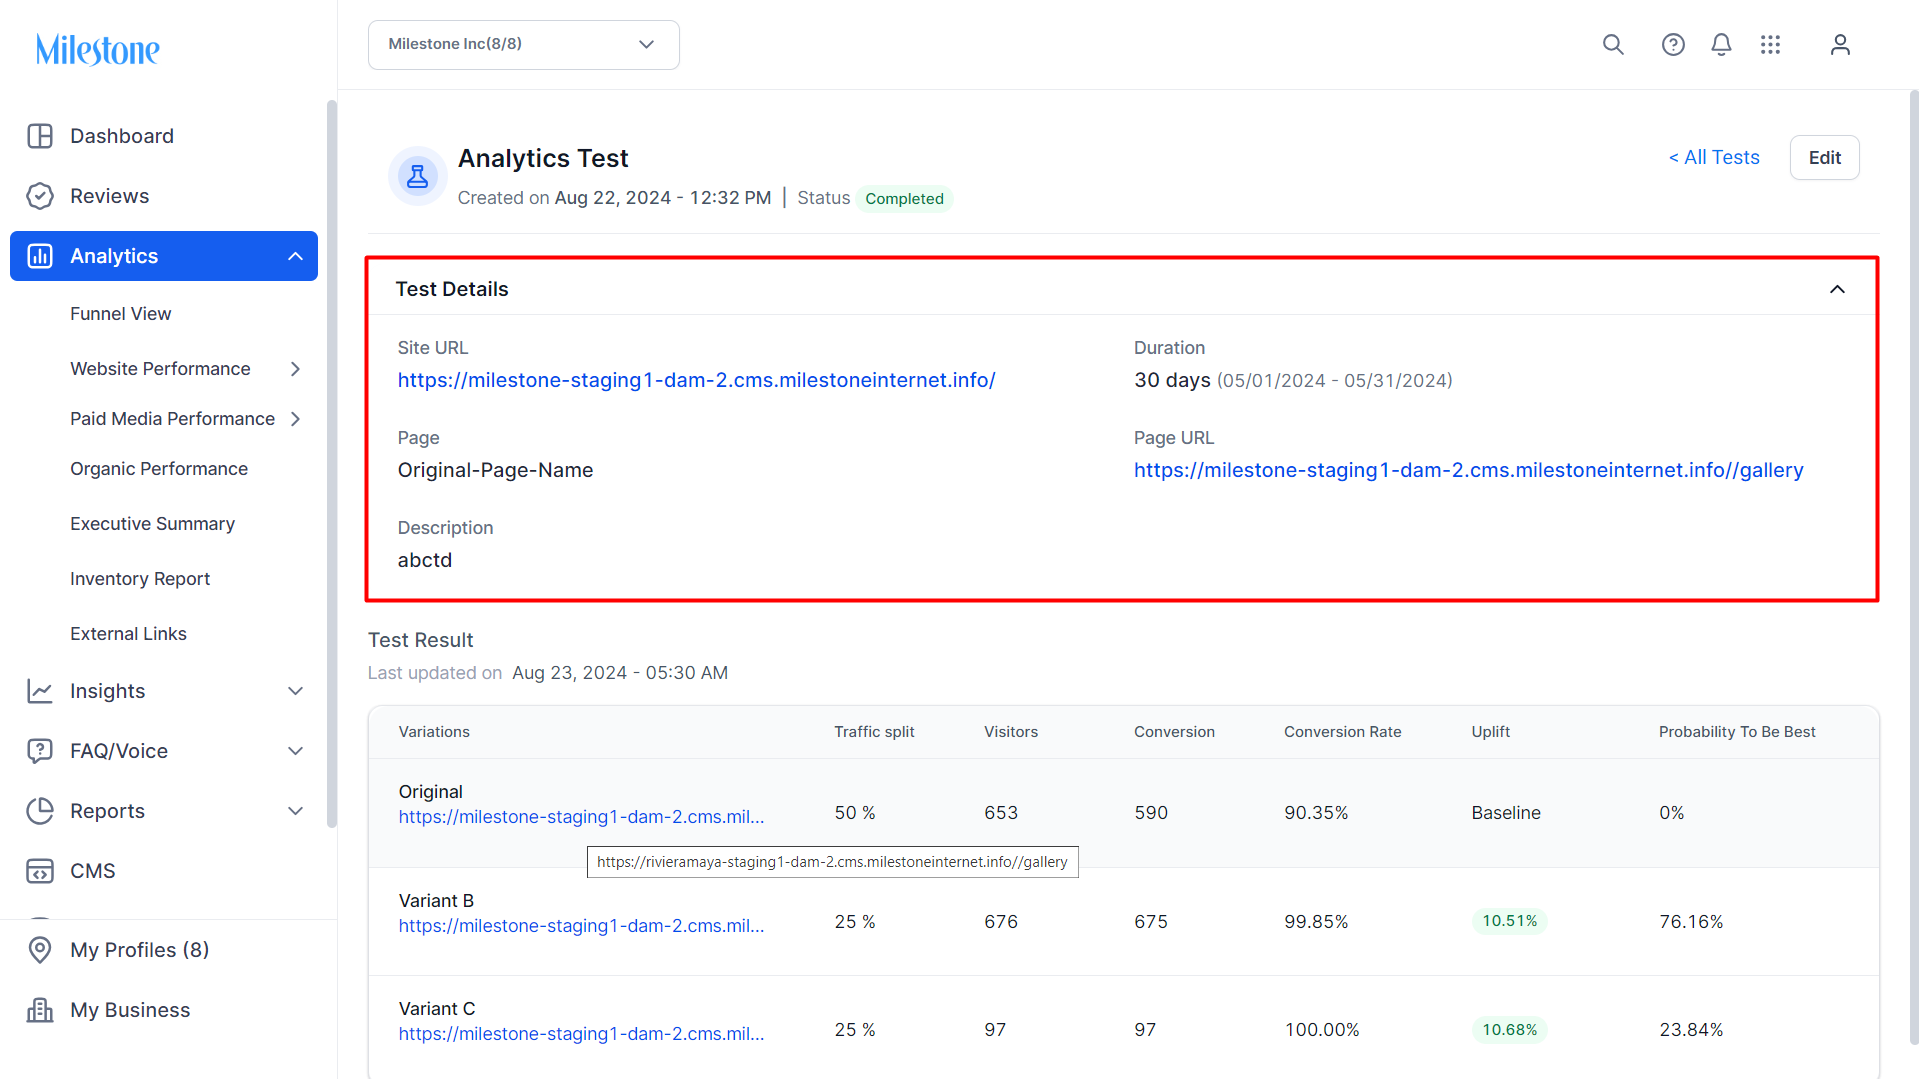
To view details of the test click on the ‘Test Details’ section to expand the dropdown. Here you can view details like, the URL for the website, the duration of the test, the name of the page, the page URL on which the A/B test is being conducted, and a brief description of the test.
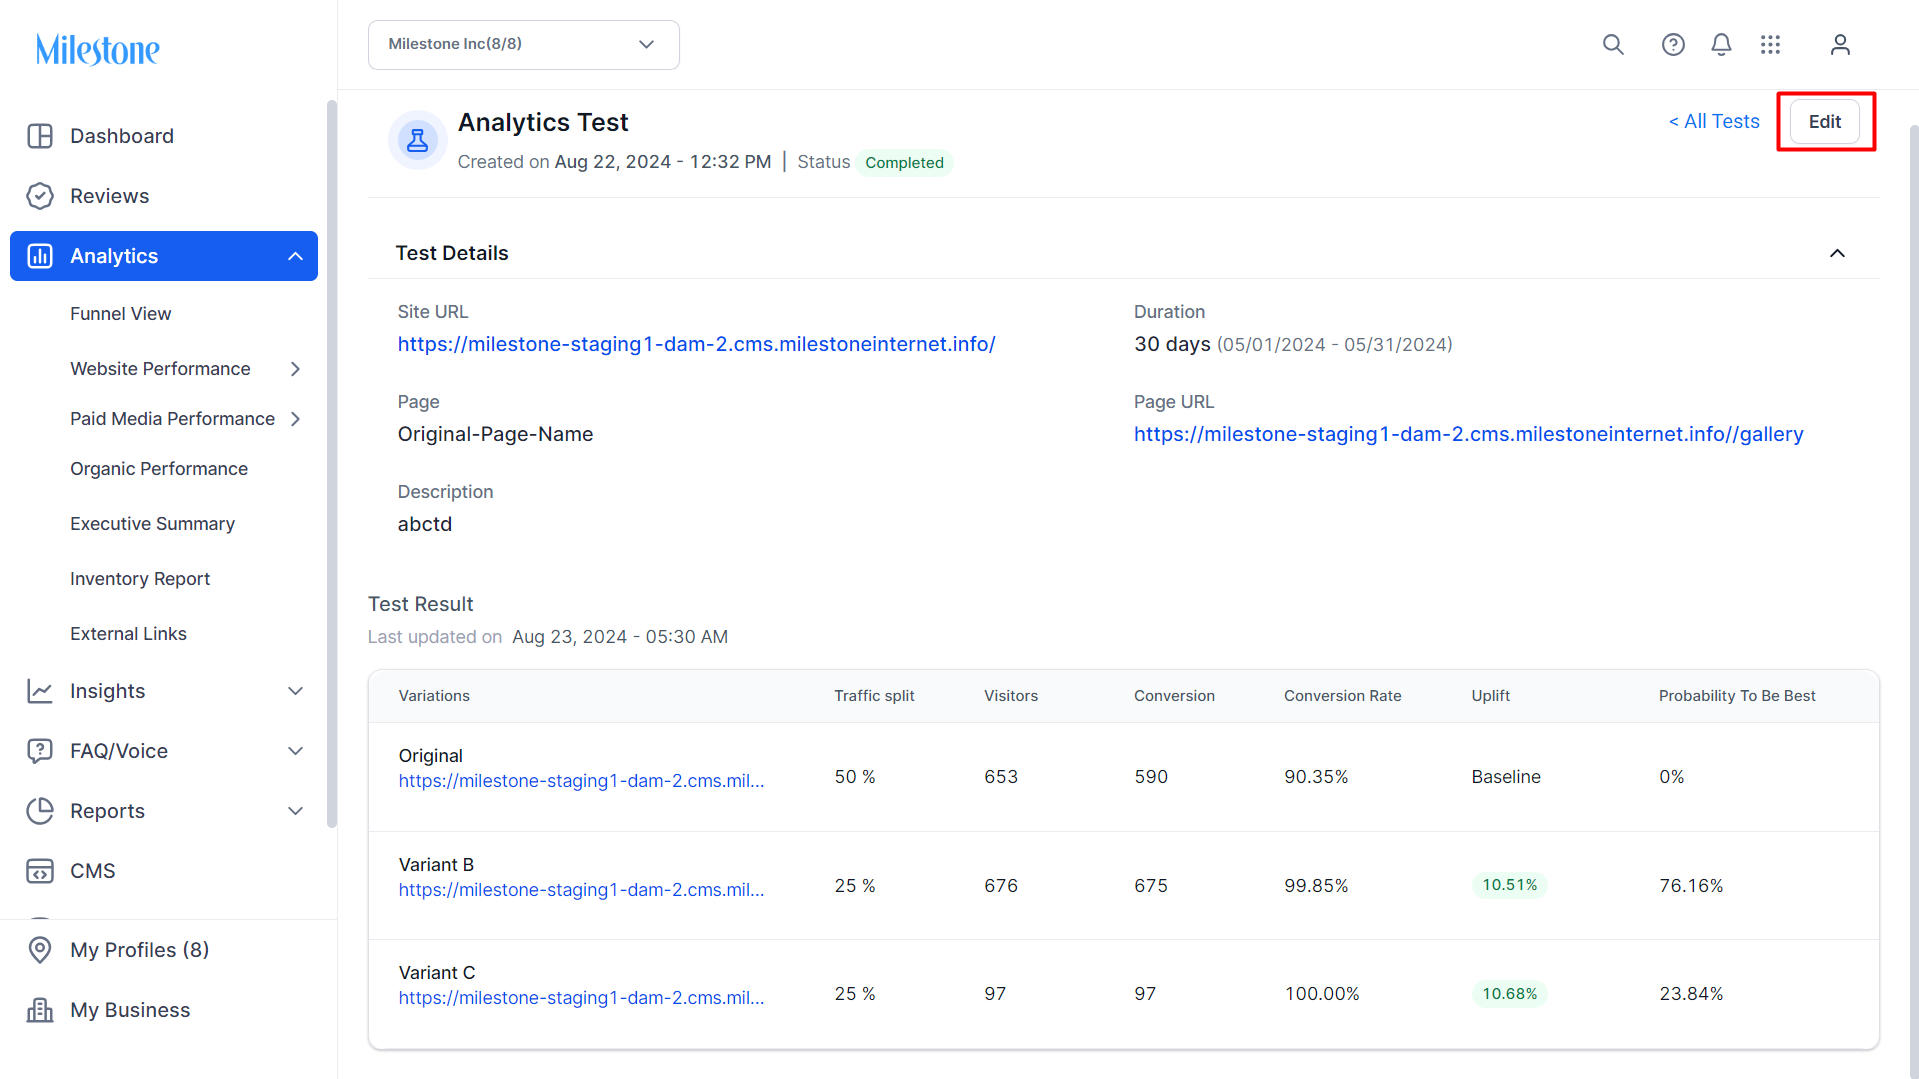
You can edit a test by clicking on the ‘Edit’ button at the top right. This will redirect you to Milestone CMS to make the changes.
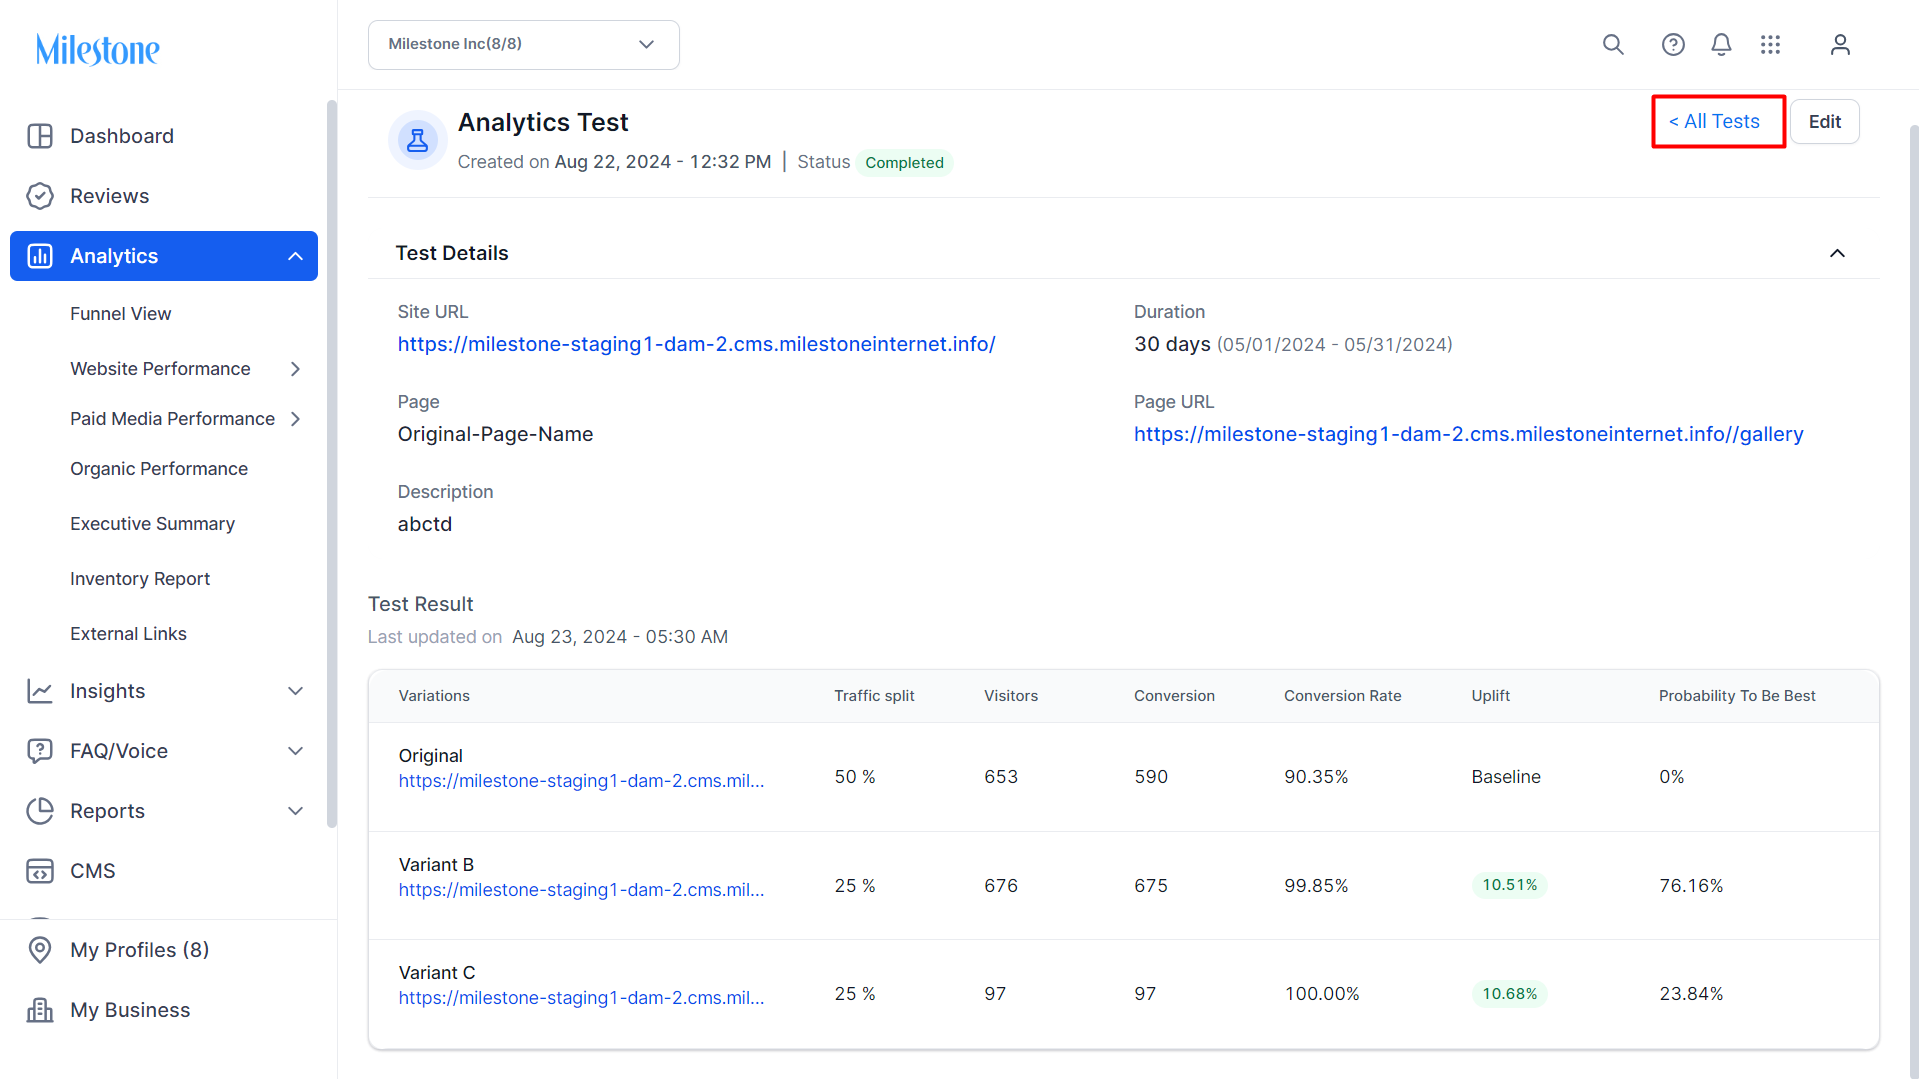
To return to view all the A/B Tests for the business click on ‘All Tests’ at the top right.
Insights
Digital Presence Report
The Digital Presence Report (DPR) is a comprehensive report of the website and local channels’ presence. The report seeks to
Add the name of your business to the DPR homepage and select the business from the search results.
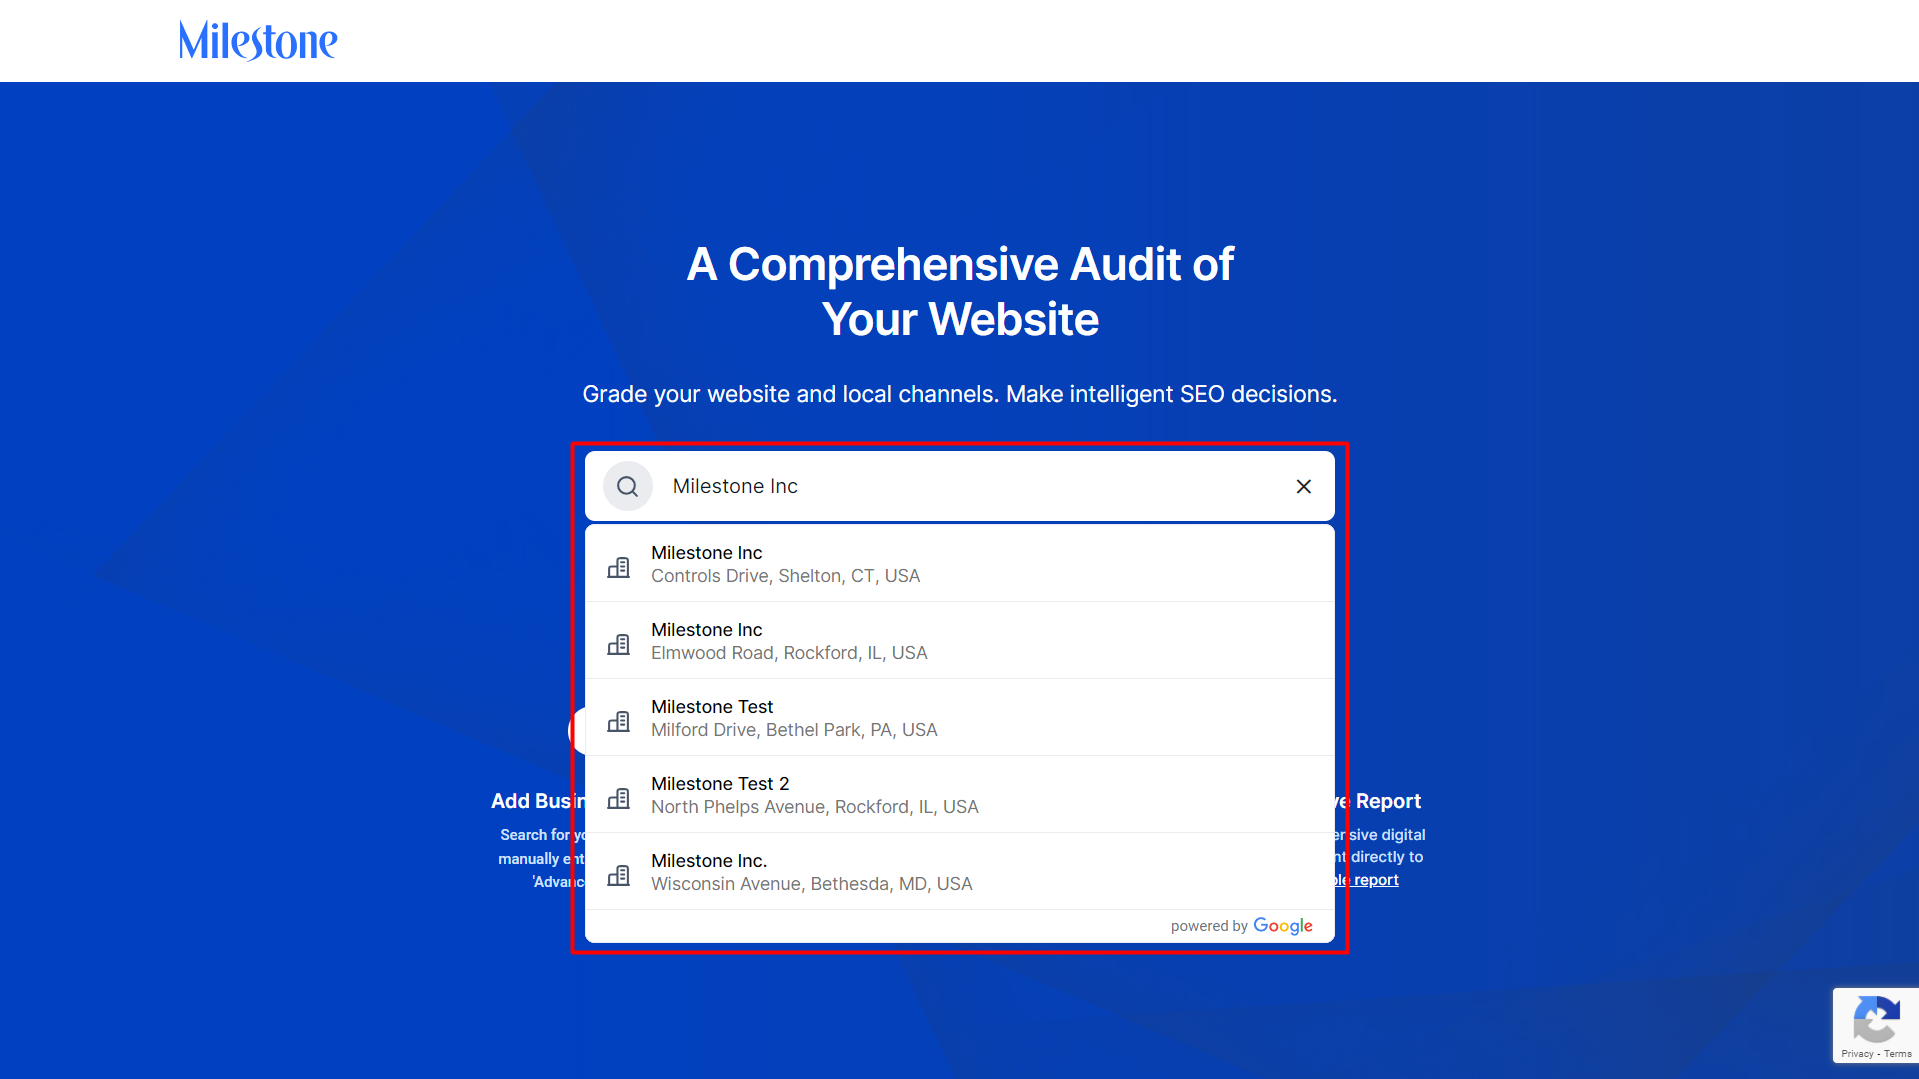
The name of the business, the URL, and the address will be auto filled from your local listings.
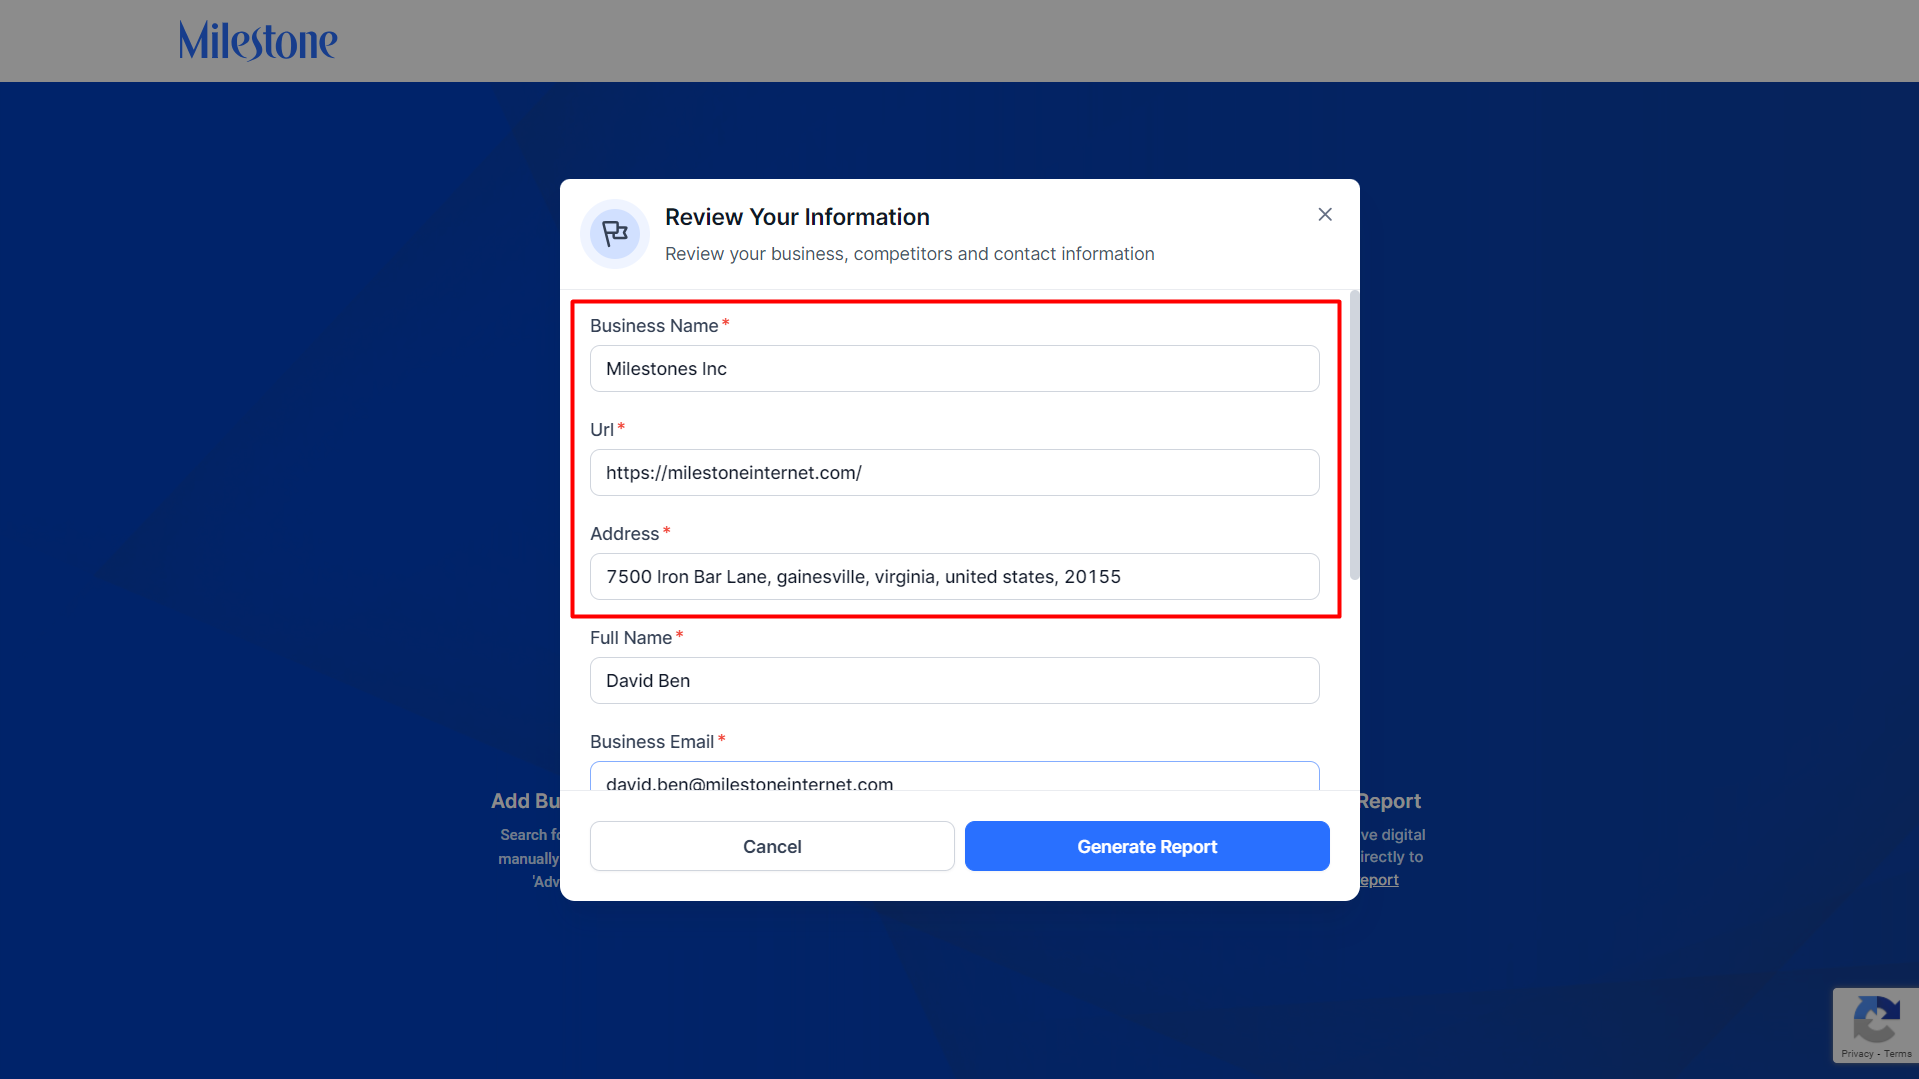
You will need to provide your full name and business email address to receive the DPR.
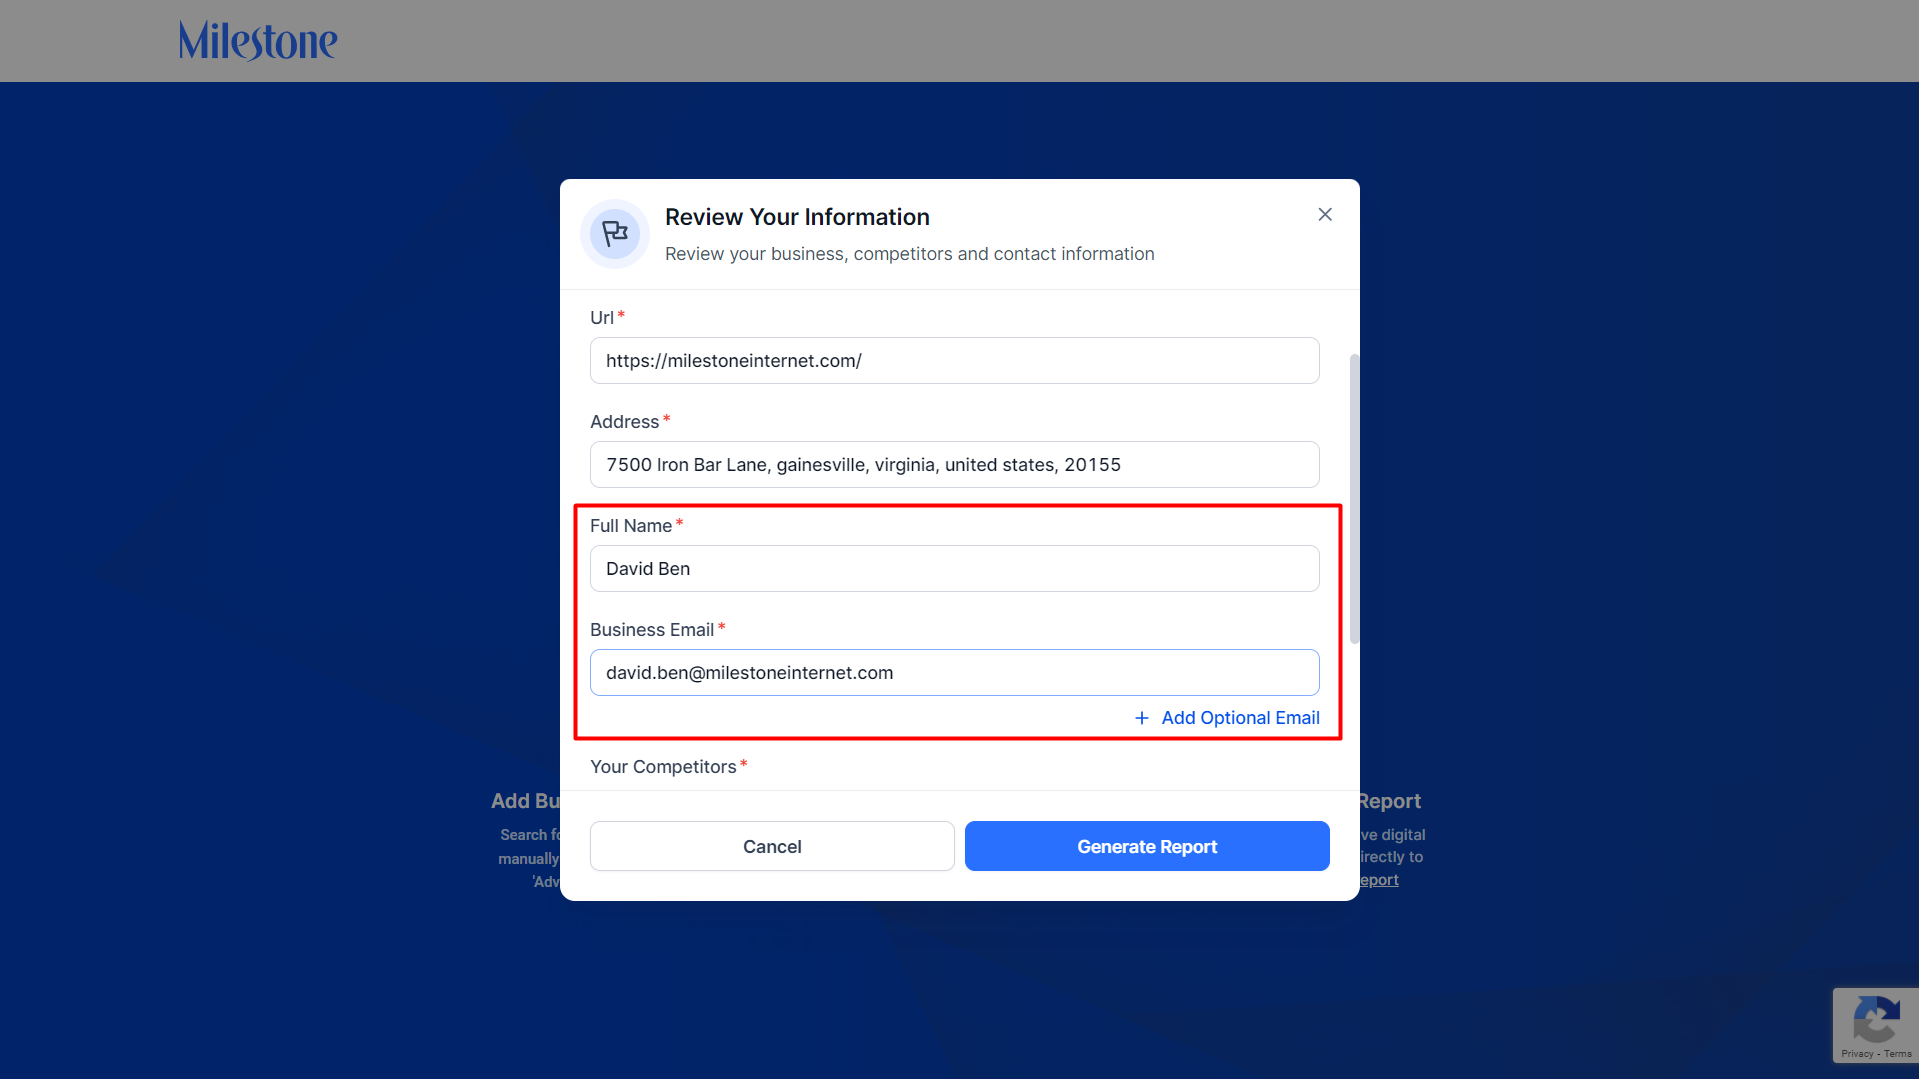
If you want to send the DPR to more than one recipient click on the ‘Add Optional Email’ button.
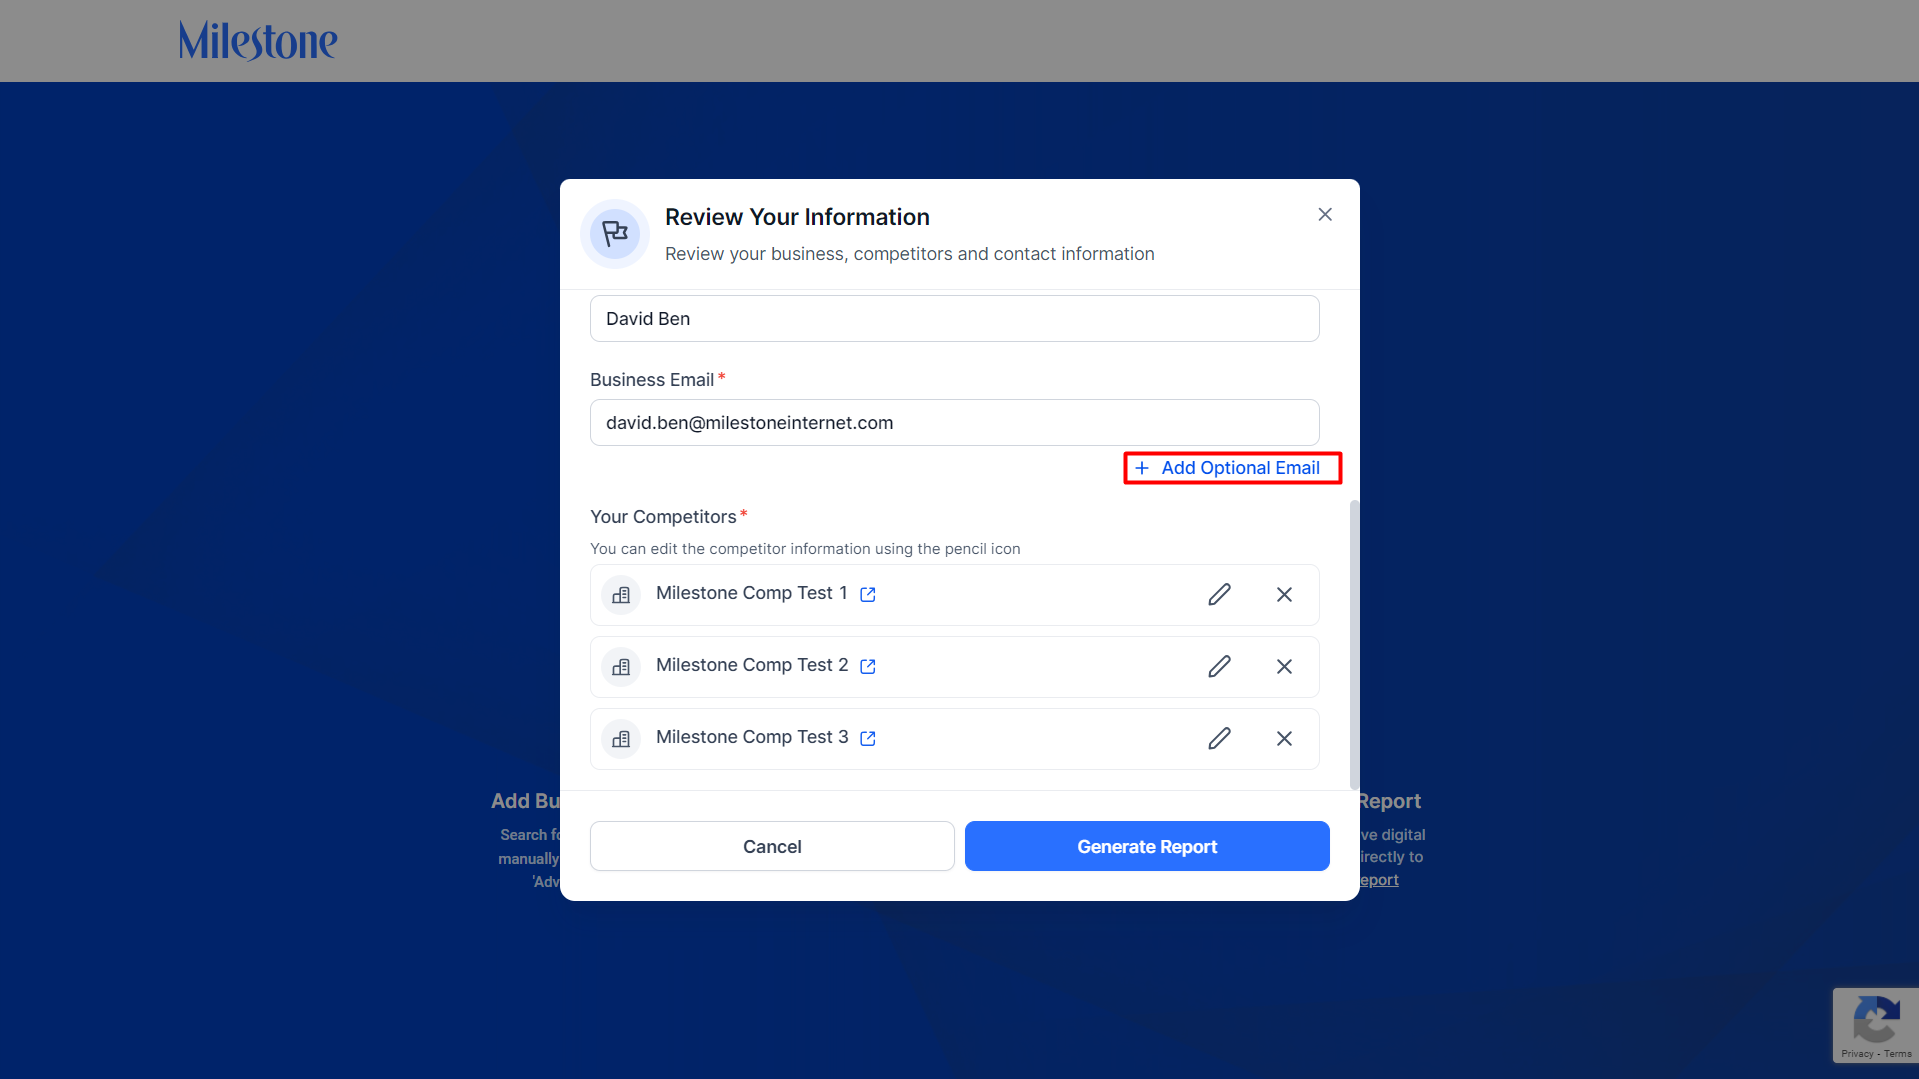
The competitors will be fetched using AI.

Edit competitors using the ‘Edit’ icon corresponding to it.

Remove competitors using the remove icon.
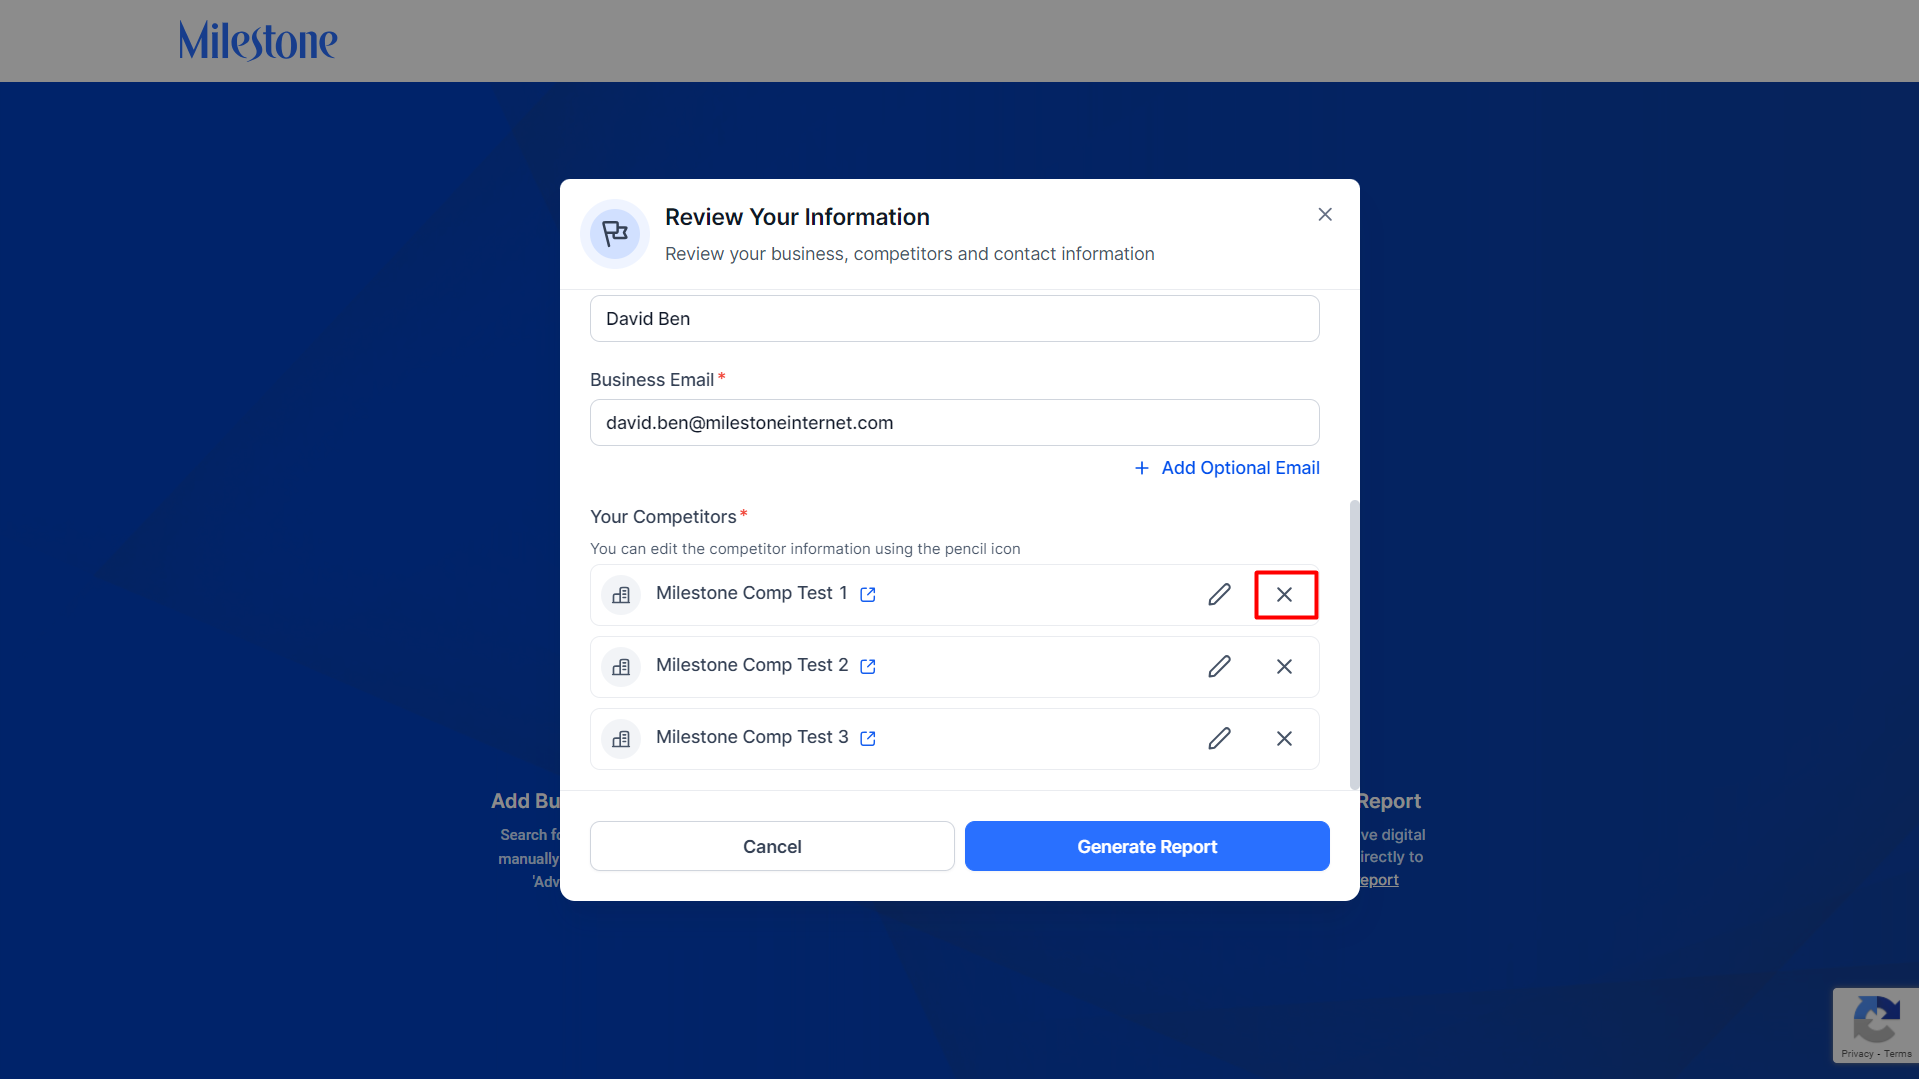
Once you have added the required details click on ‘Generate Report’.

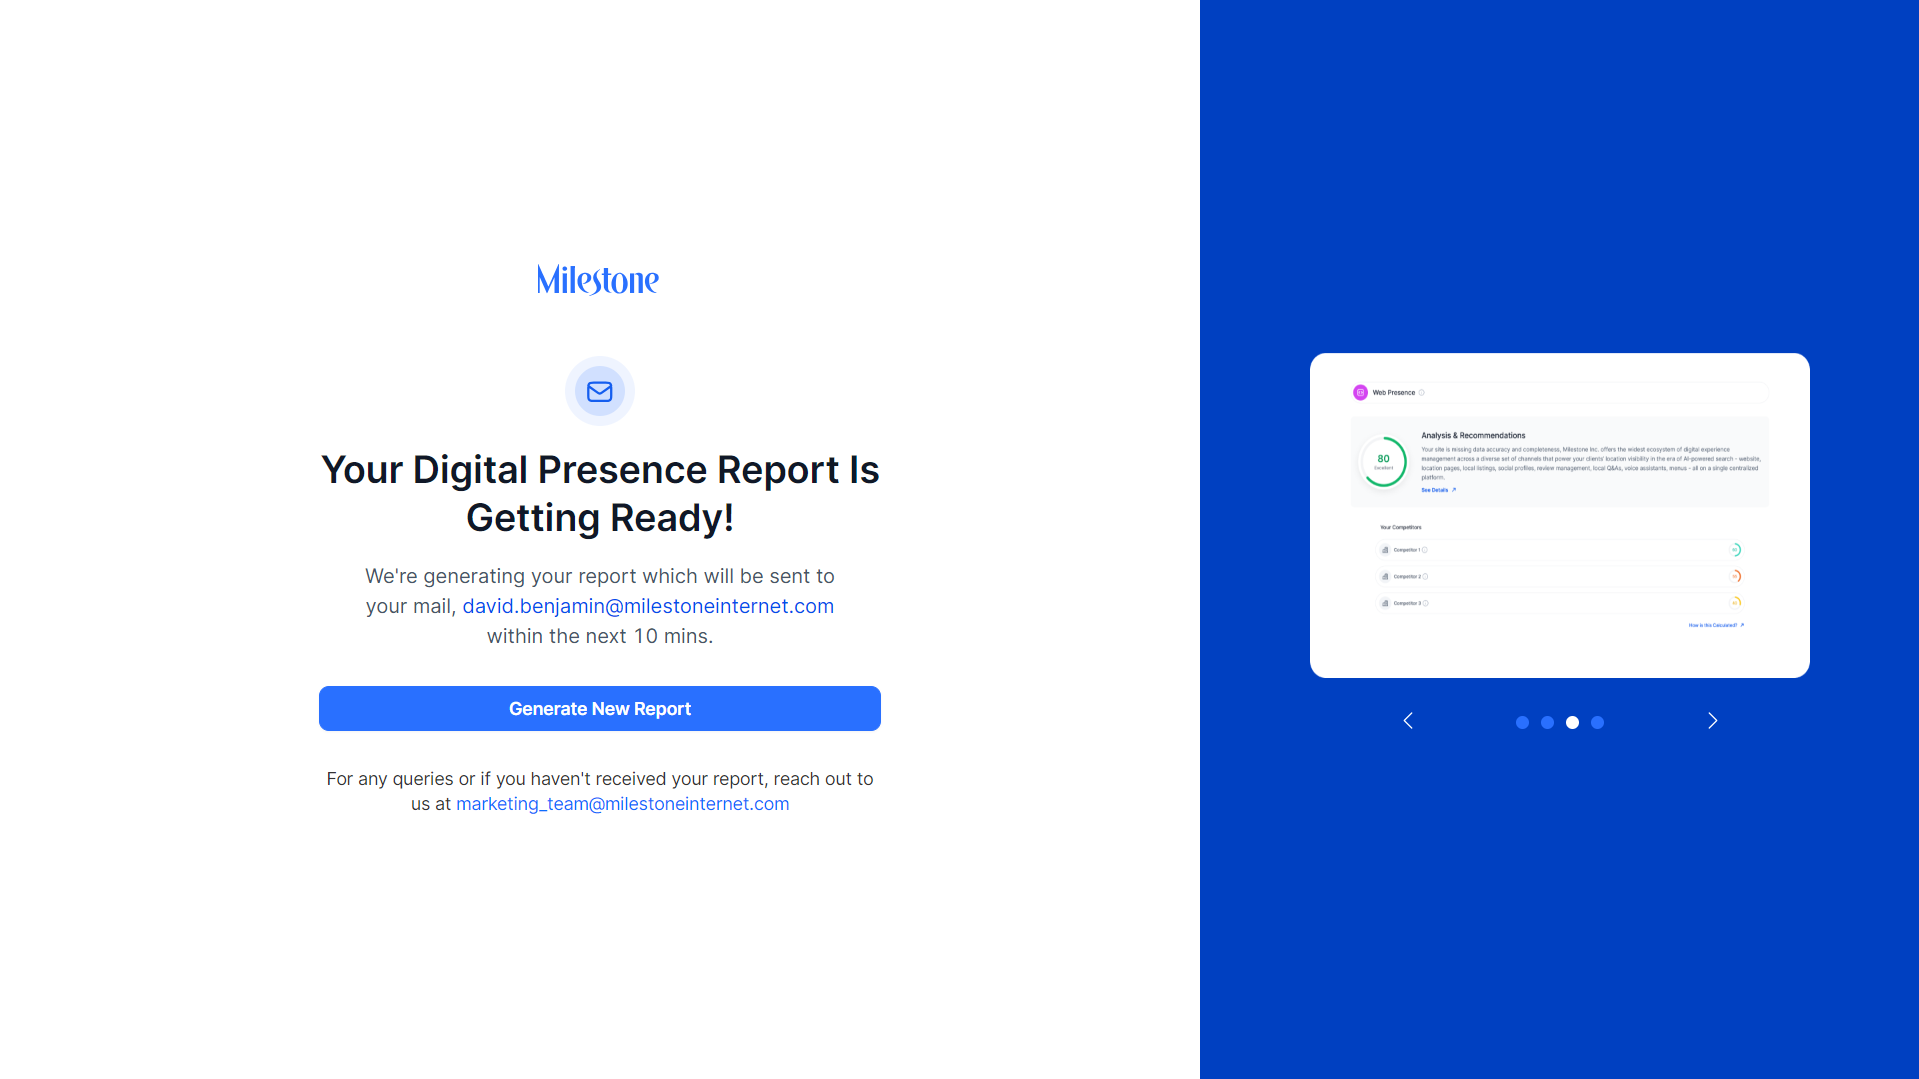
You will be notified that the DPR will be sent to your email in 10 minutes.
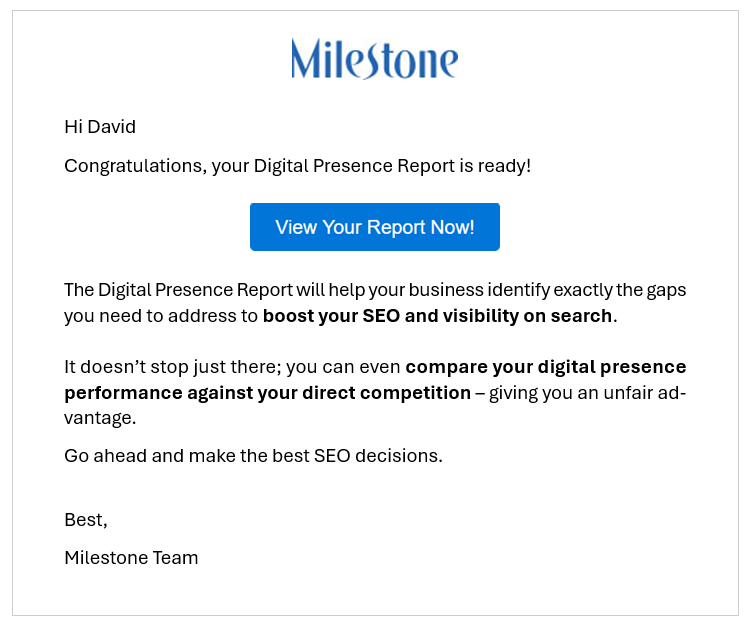
You will receive an email with a link to the Digital Presence Report. Click on ‘View Your Report Now!’ to view the DPR.
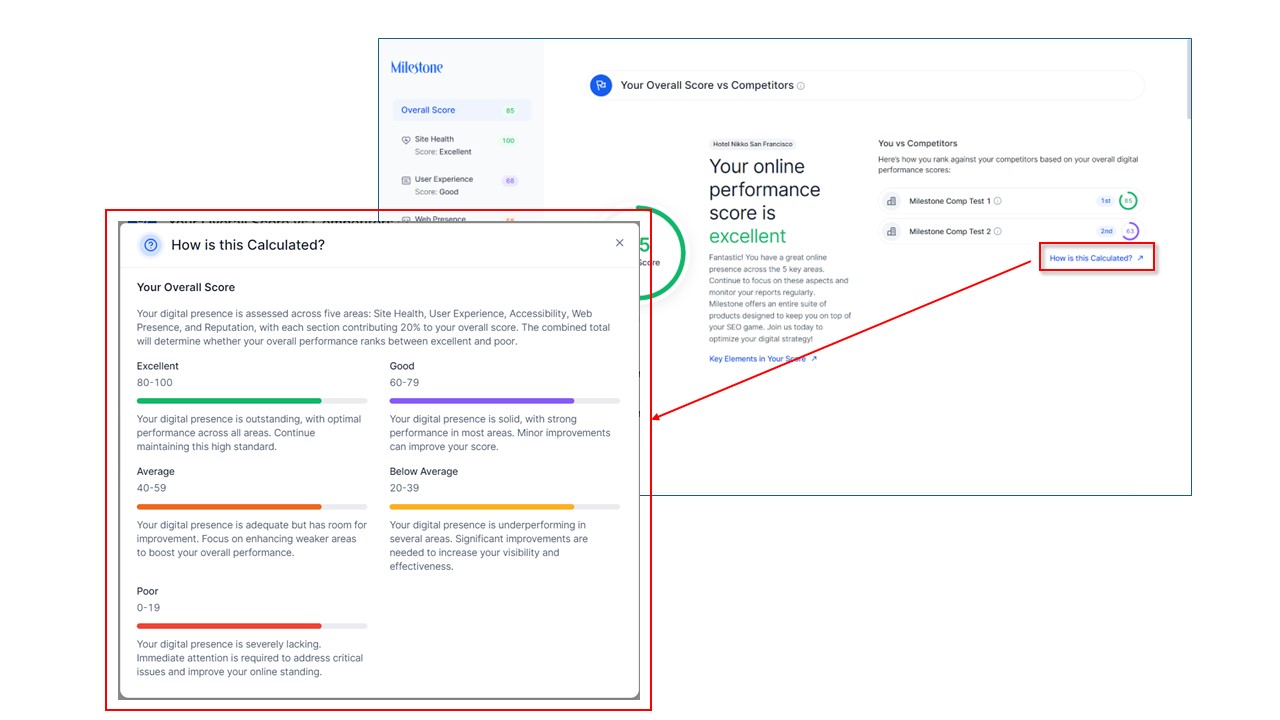
The DPR will open to your overall score versus your competitors.
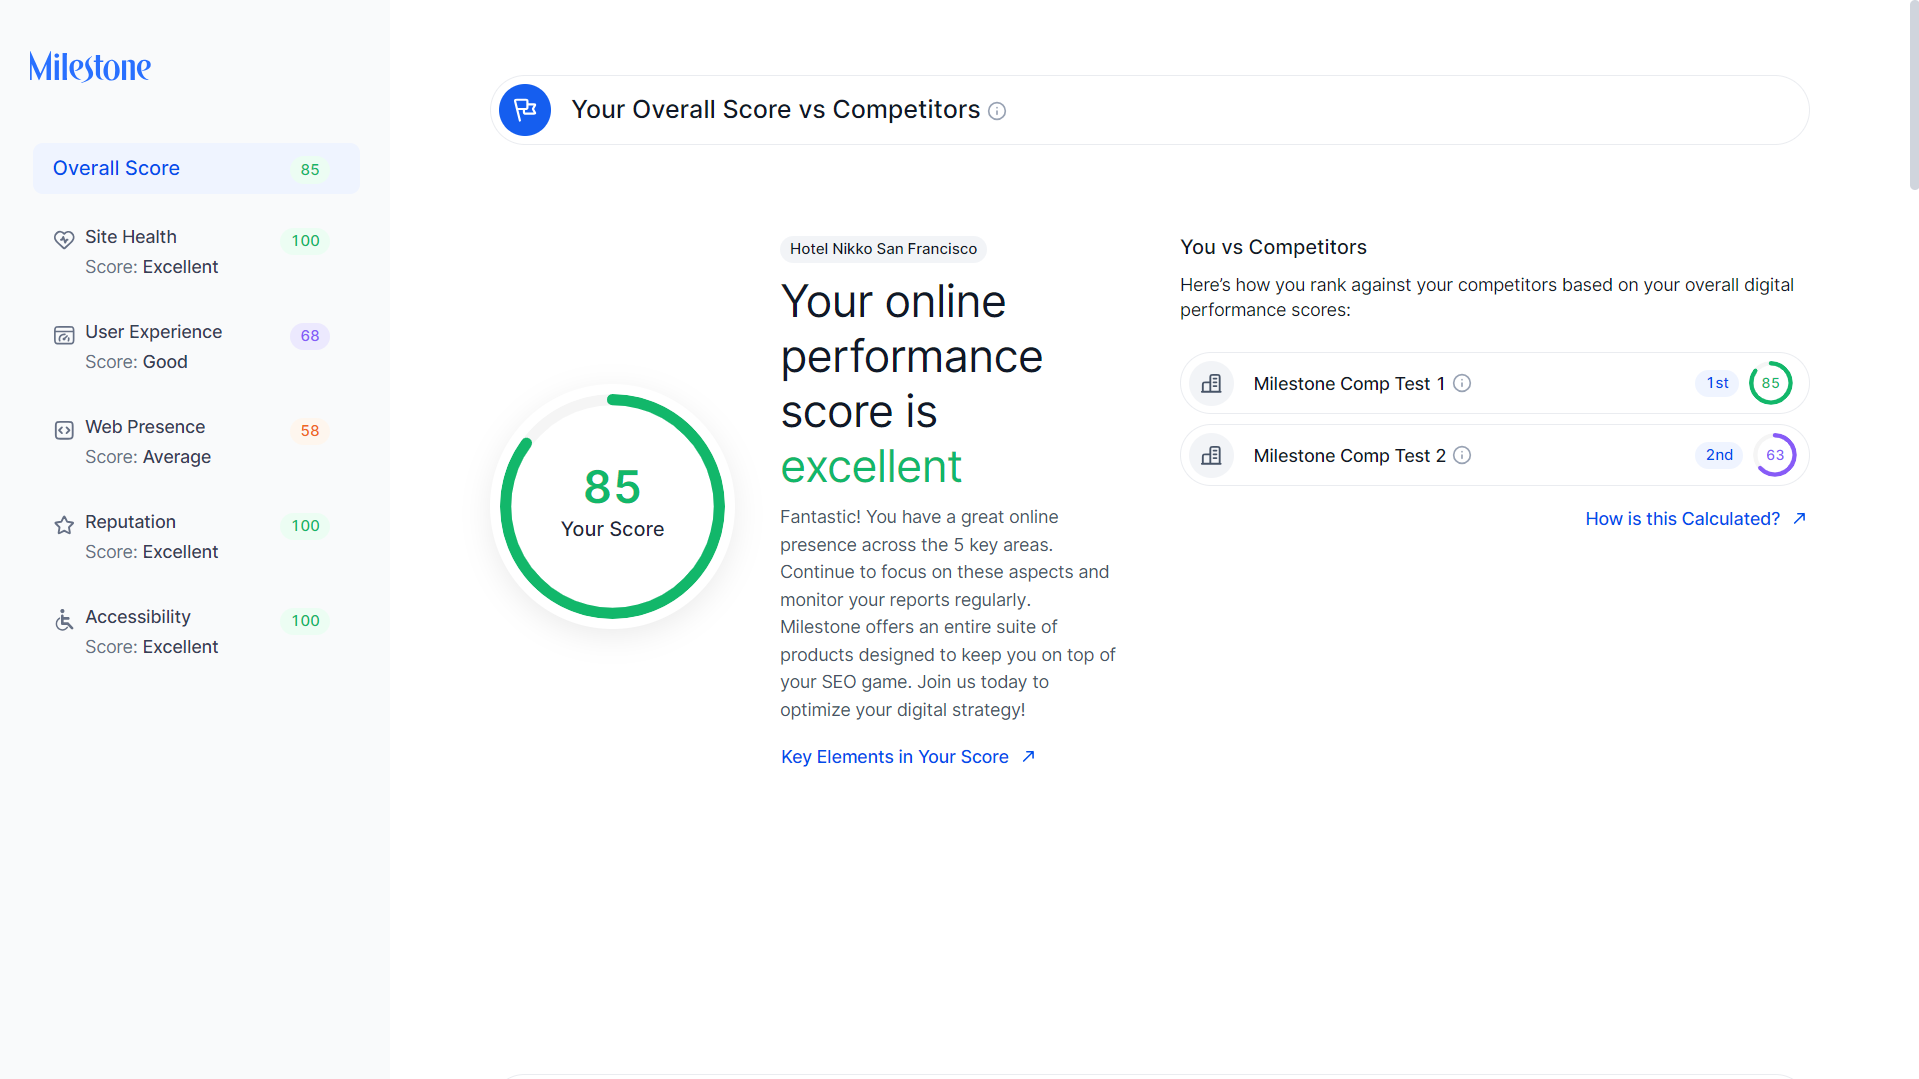
To view how the overall score is calculated click on ‘How is this calculated?’.
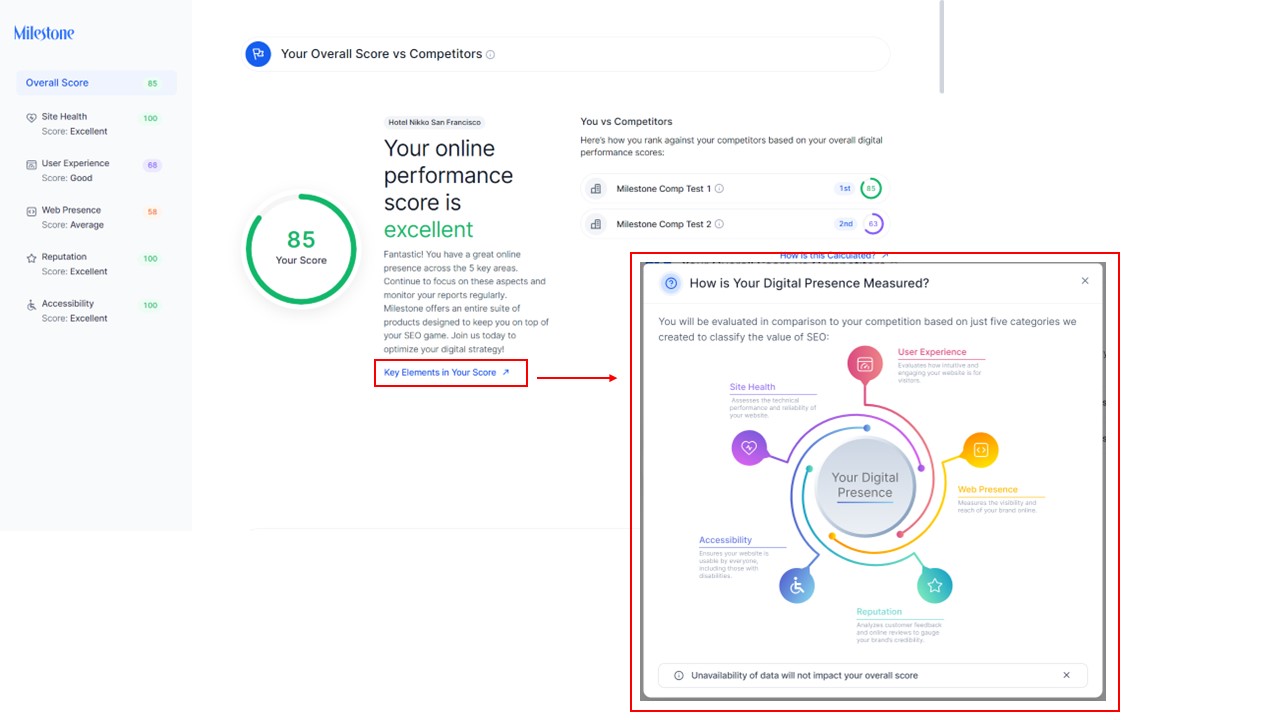
To view what is considered when calculating this score click on ‘Key Elements in Your Score’.
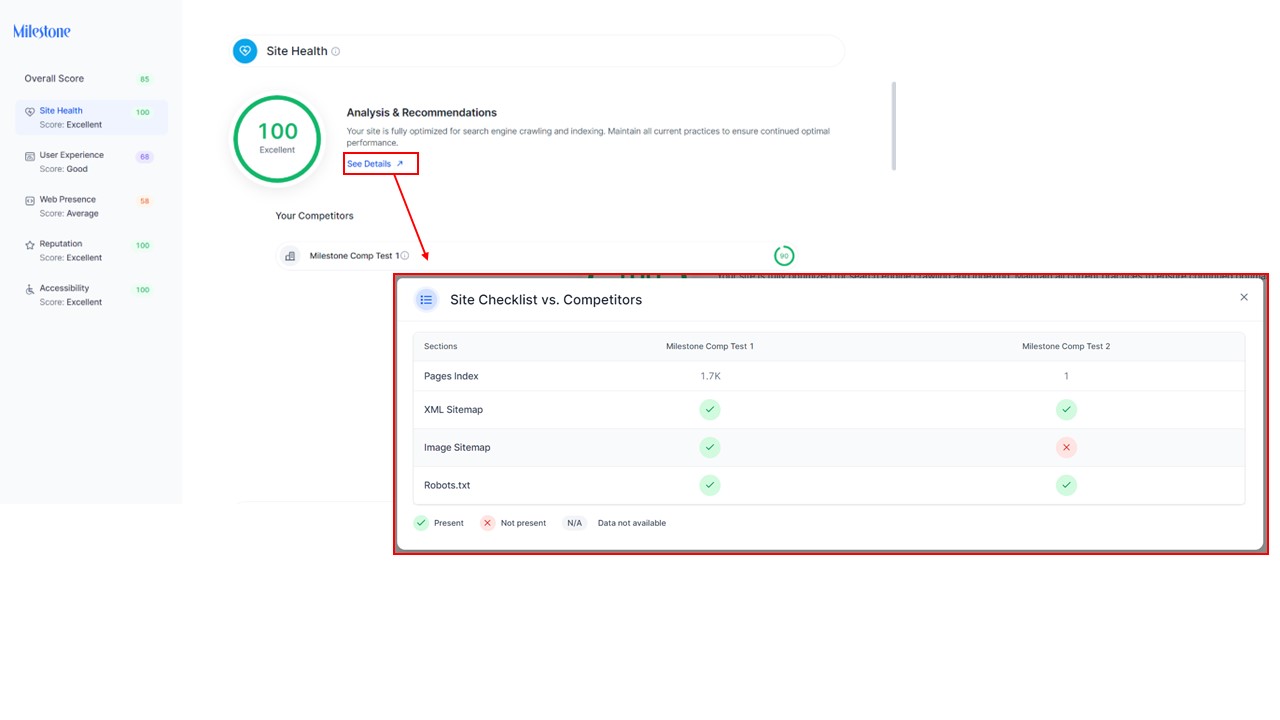
Site Health
The Site Health section assesses the overall technical health of your website and its readability. To view the details of your site health versus those of your competitors click on ‘See Details’.
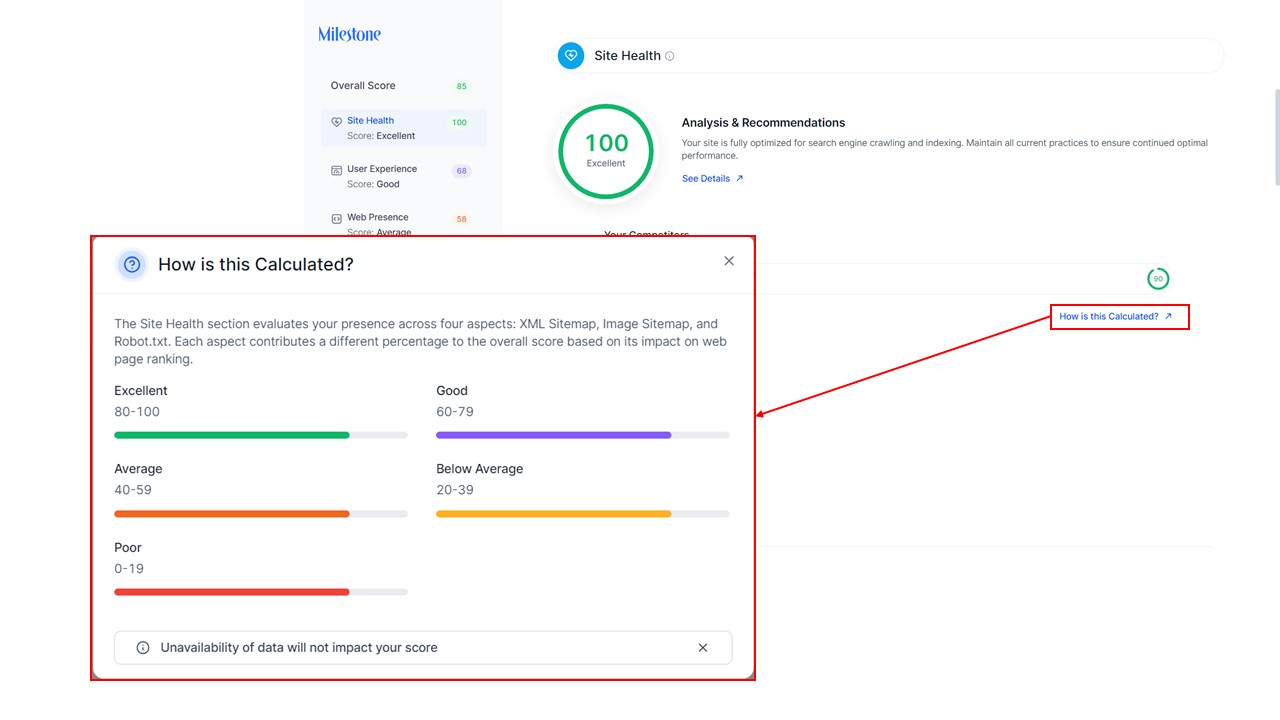
To view how Site Health is calculated click on ‘How is this calculated?’.
User Experience
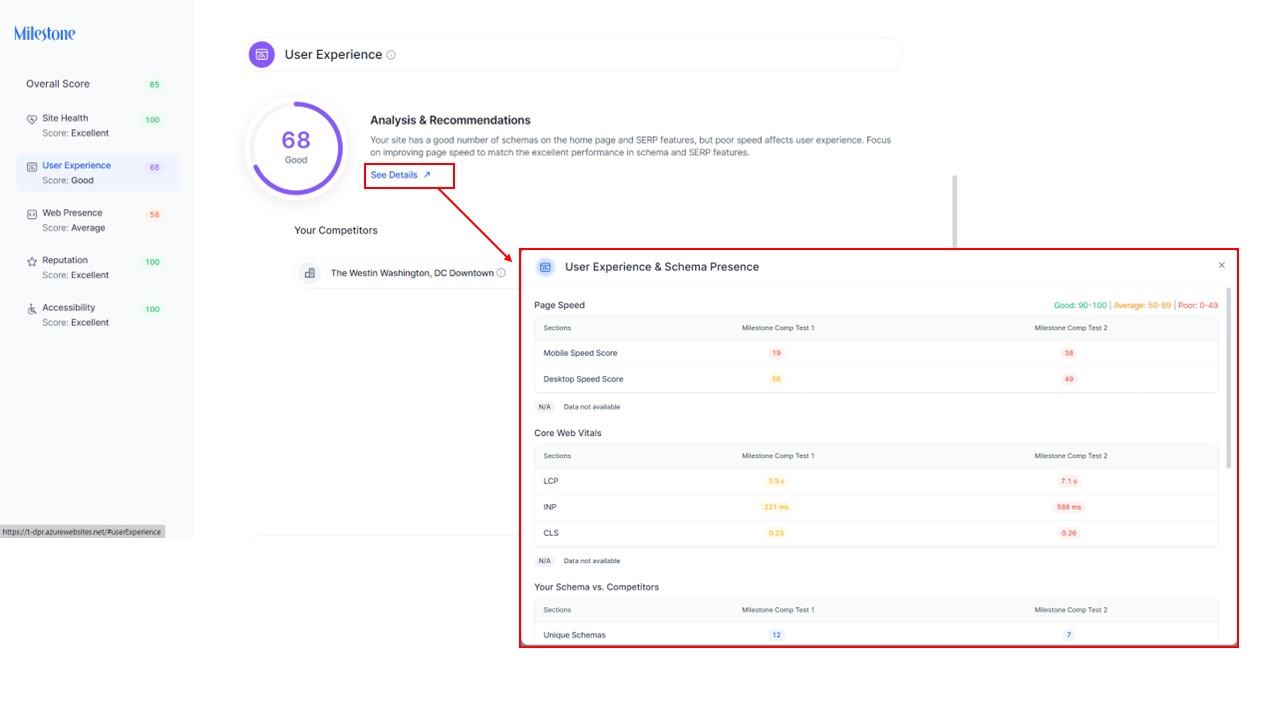
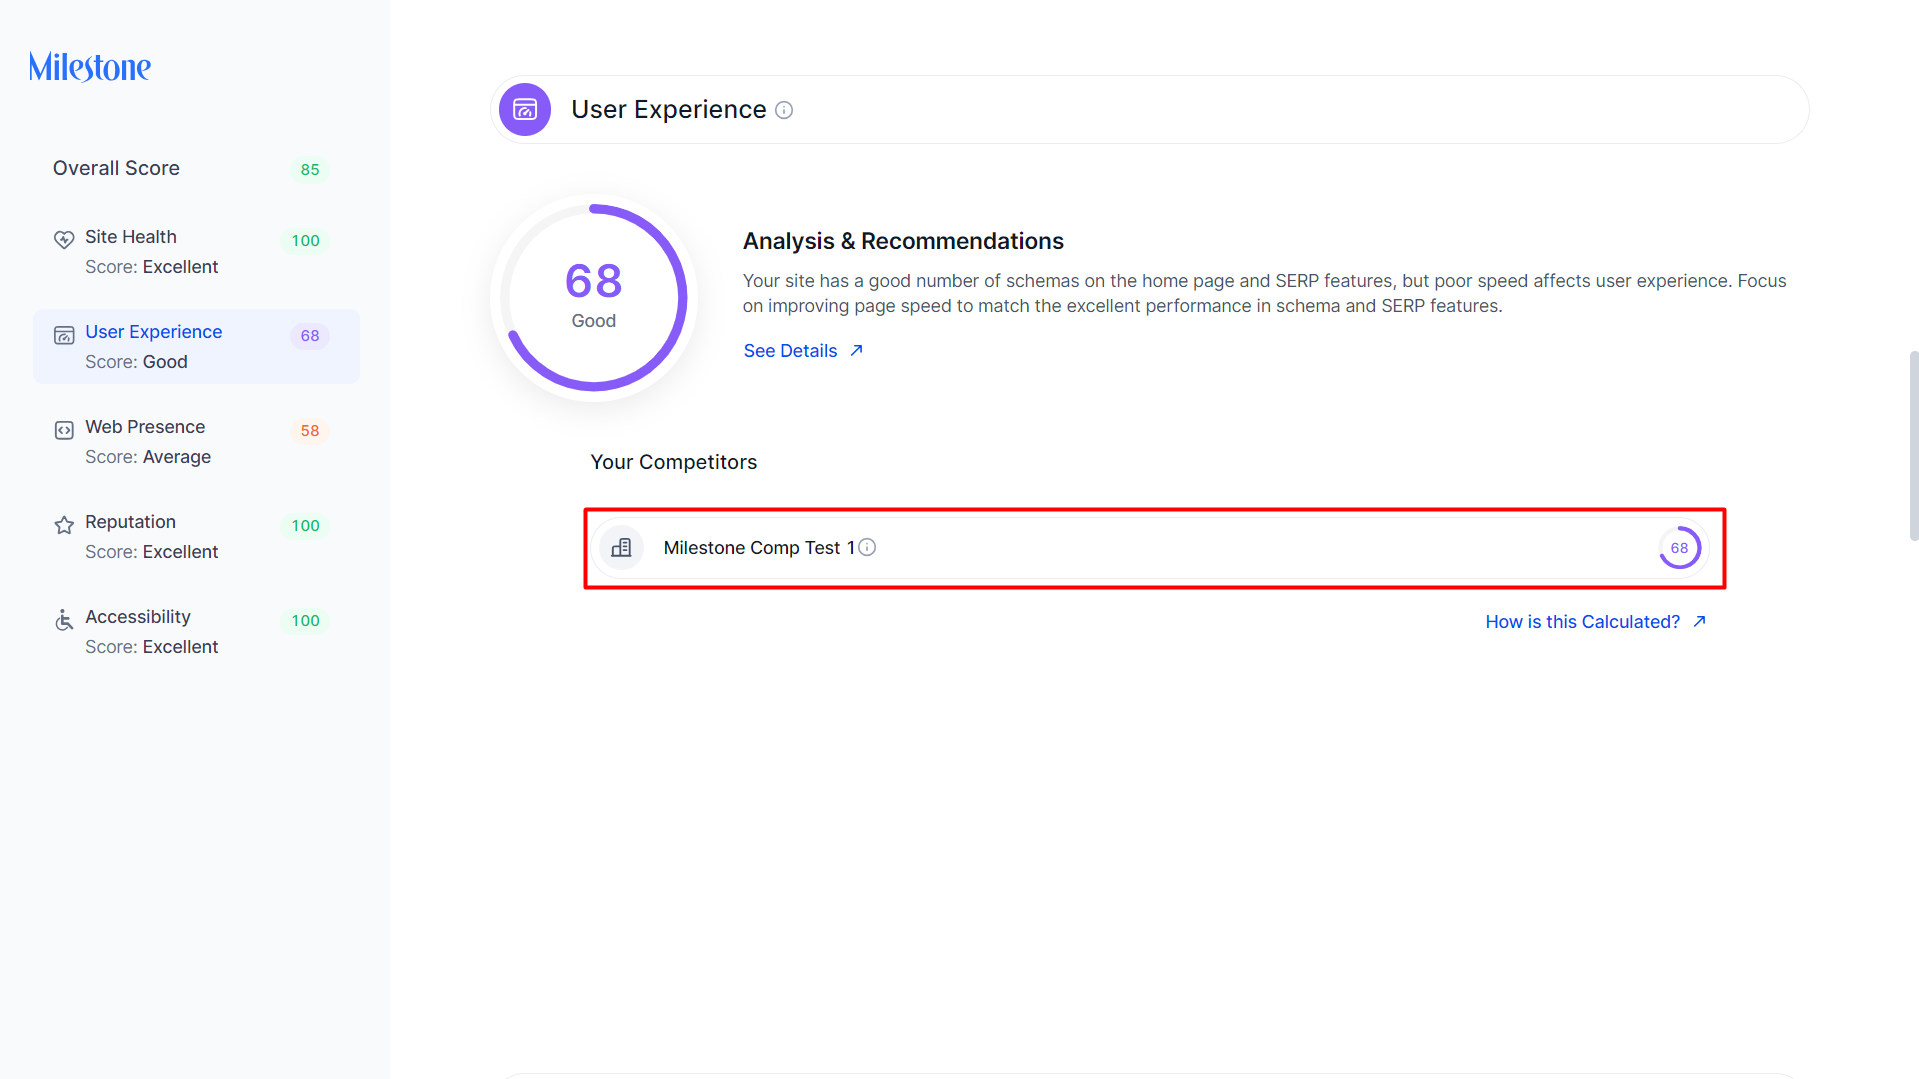
The User Experience section of the DPR analyzes the overall user experience your page is providing to a user. This is calculated based on Page Speed, Core Web Vitals, Schema, and Universal Search Results. To view detailed results of your website versus your competitors click on ‘See Details’.
You can see the User Experience score of your closest competitor here.
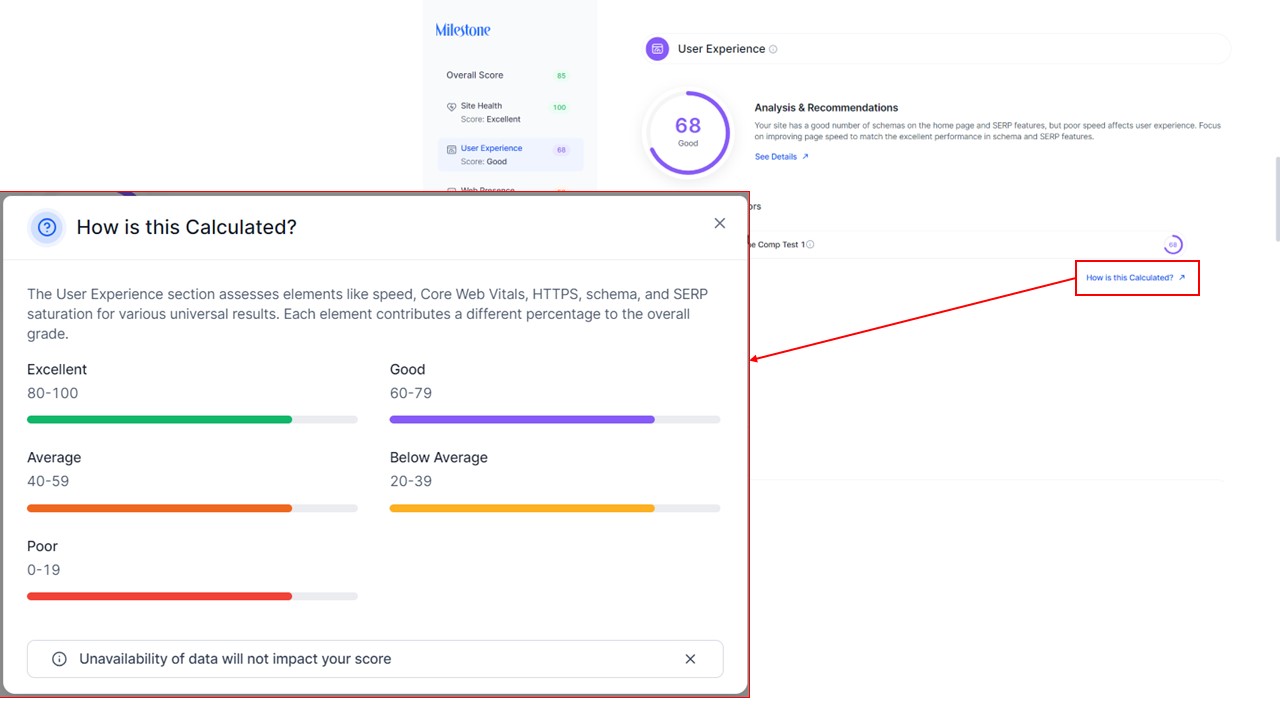
To view how the User Experience score is calculated you can refer to the ‘How is it calculated?’ section.
Web Presence
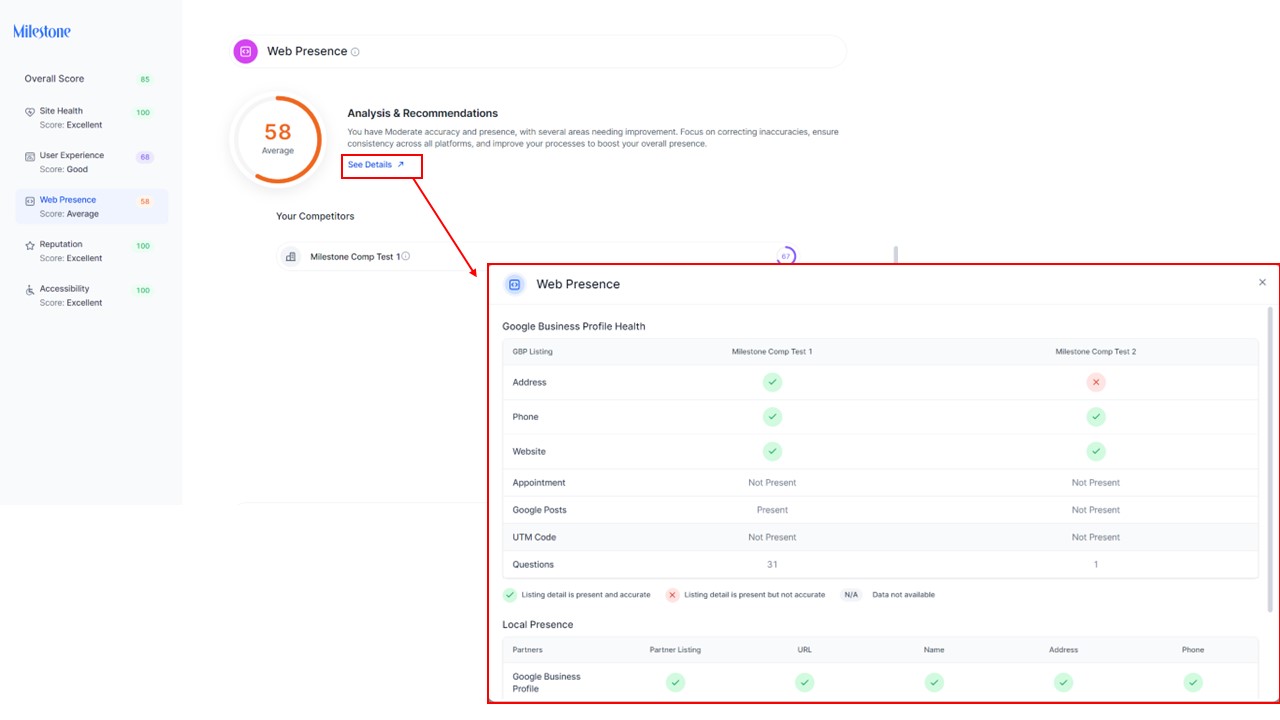
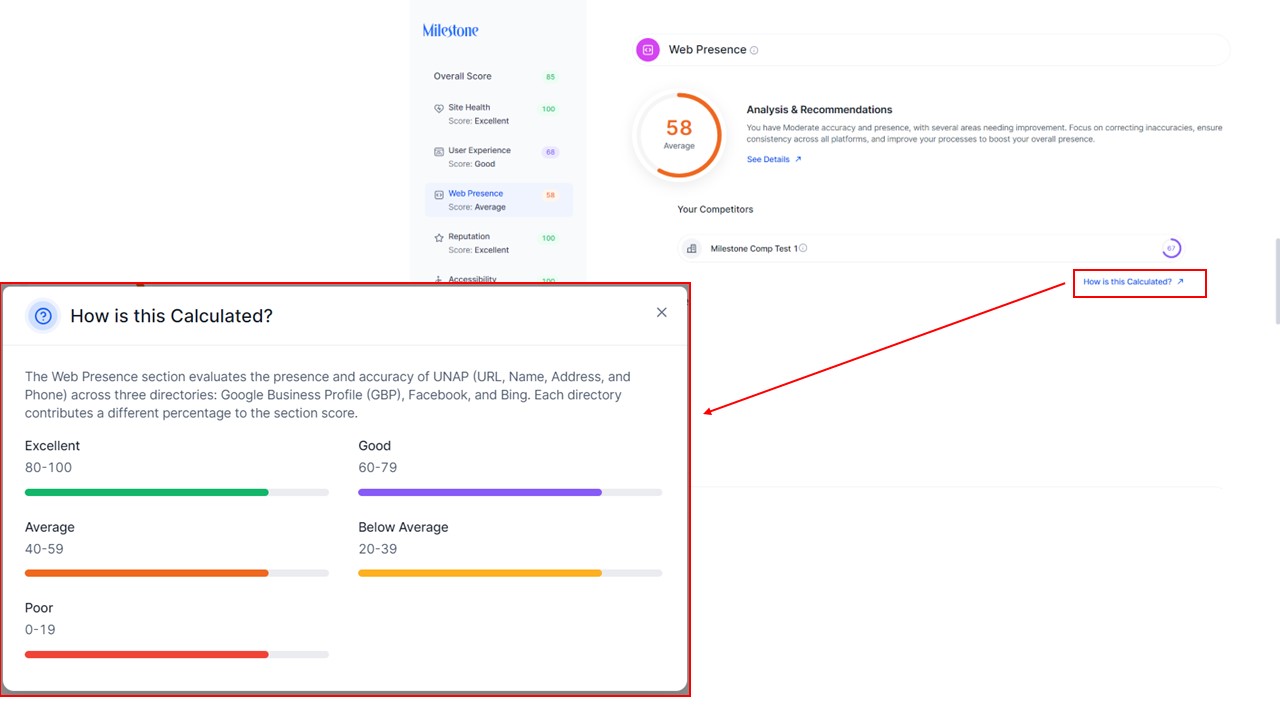
The Web Presence displays the accuracy and visibility of your online presence across platforms like Google Business Profile and local listings. Spot gaps and opportunities to strengthen your digital footprint.
To view detailed results of your ‘Web Presence’ versus your competitors click on ‘See Details’.
To see how the Web Presence score is calculated refer to ‘How is this Calculated?’.
Reputation
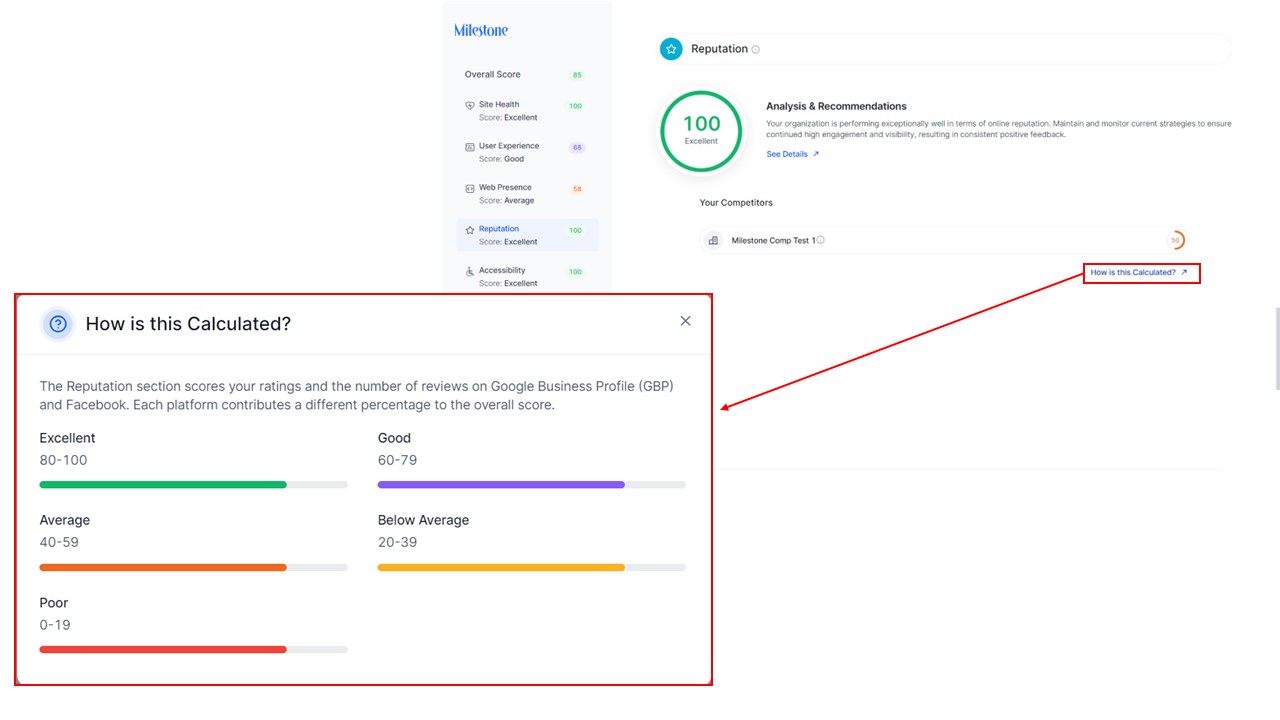
The Reputation section of the DPR analyzes your online reputation by comparing star ratings, reviews, and social media engagement. Gain insights into customer perceptions and areas to improve your brand image.
To view details of your online reputation versus your competitors click on ‘See Details’.
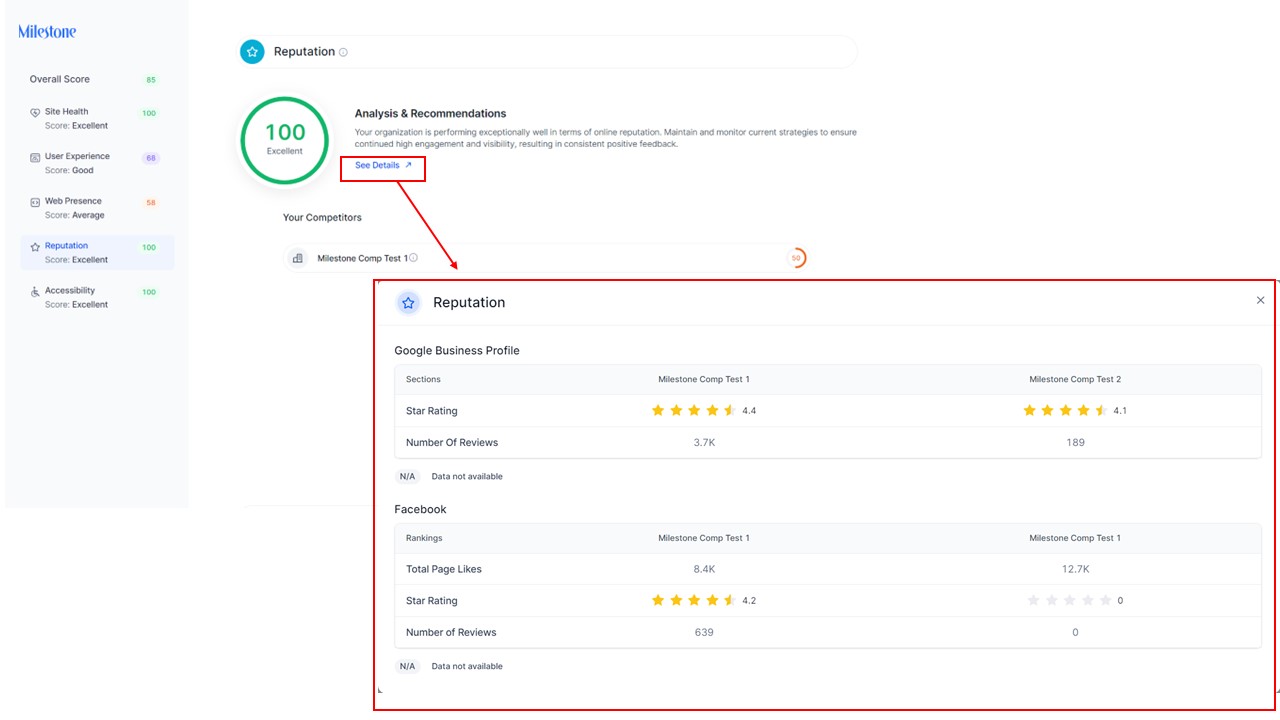
To view how your online reputation score is calculated refer to ‘How is this Calculated?.
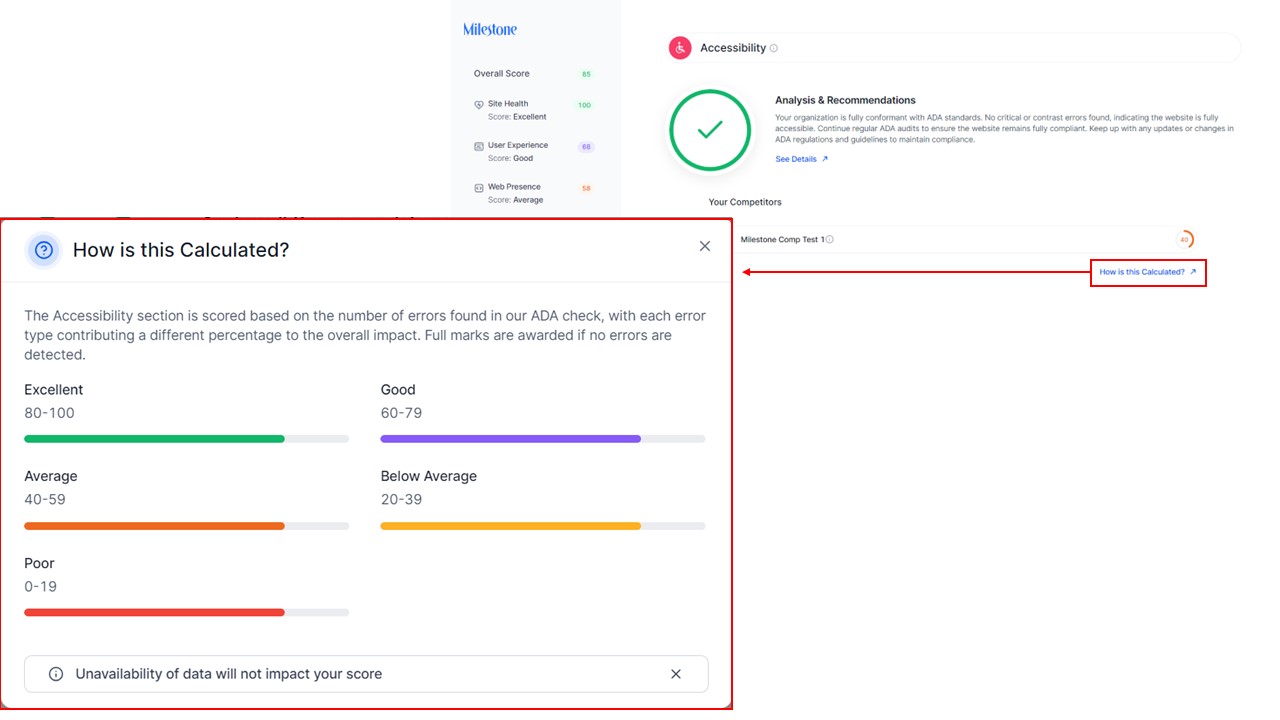
Accessibility
The ‘Accessibility’ section assesses your website for ADA compliance, focusing on accessibility errors and contrast issues to ensure an inclusive experience for all users.
To view details of your website’s ADA compliance click on ‘See Details’.
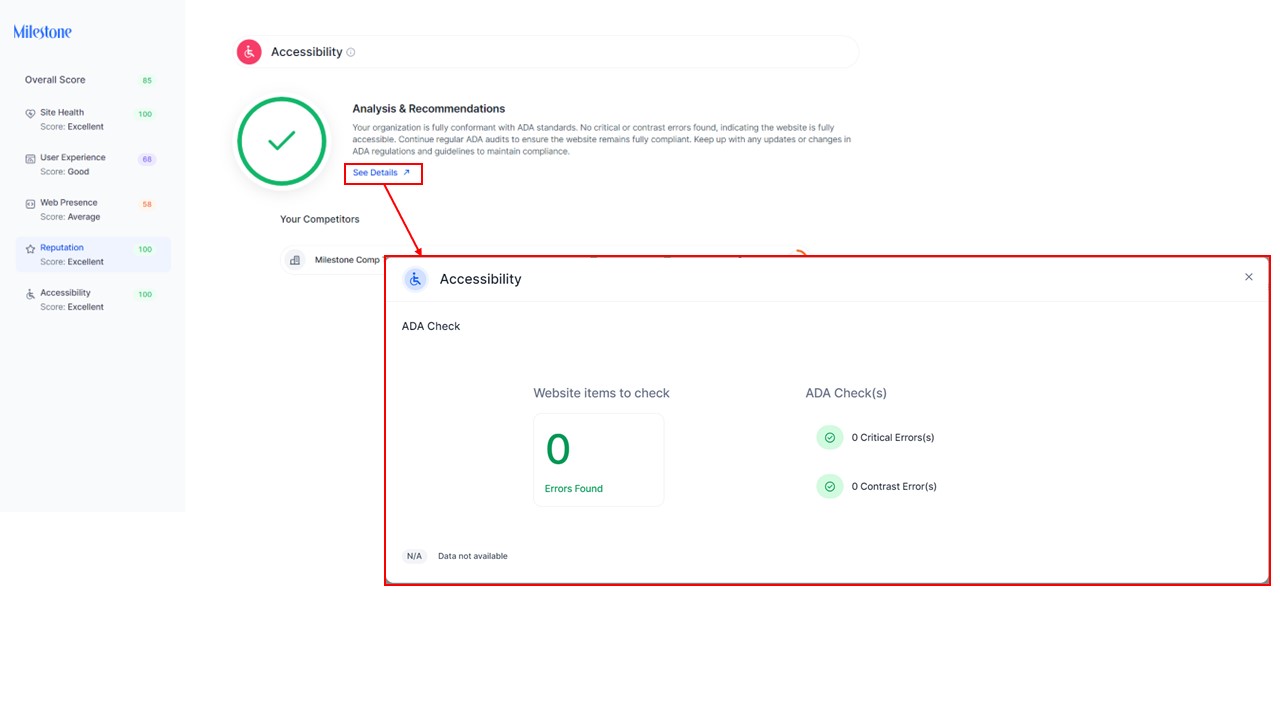
To view how your website’s accessibility is assessed click on ‘How is this Calculated?’.