Release: Jan 1, 2021
Local & Reviews:
1. Listing Status by Location UI Revamp
Opportunity: User experience that displays key aspects such as overall profile completeness score, accuracy score, and other fields such as duplicate listings and activities carried out by Milestone.
Solution: Our new ‘Local Status by Location’ screen gives business all that they need to know with regard to profile completeness, managed accuracy score, profile accuracy of GMB and other directories, duplicated profile information that have been flagged and activities carried out by Milestone to improve the profile completeness and accuracy score of the business and each of its locations.
Local> Listing Status > Click on a business profile > Listing Status by Location

Using the ‘All Locations’ drop-down filter, businesses can view their locations that have 100% profile completeness, completeness of their Core Information (UNAP, Description, Special hours, etc.,) more than 75%, media completeness of more than 50%, and so on.

2. Listing Status by Source UI Revamp
Opportunity: Offer in-depth data of the ‘Listing Status by Source’ to businesses on a single screen
Solution: The new ‘Listing Status by Source’ screen displays the fulfillment progress of all the business locations as well as the percentage of location on different directories that are In-Sync, In-Progress, Monitored, Submitted, locations that need manual actions and those that are unassigned.
Local> Listing Status > Click on a business profile > Choose Listing Status by Source

Using the ‘Sources’ drop-down filter, businesses can filter the sources they wish to view the data.

3. Profile Completeness widget added to the Performance Summary screen
Opportunity: Display key profile
completeness data that Google considers as a ranking factor
Solution: A single widget that displays the
profile completeness of all the business locations and offers key
insights and action buttons to improve profile completeness of the
business locations.
Local > Performance Summary > Profile Completeness widget
The ‘Profile Completeness’ widget displays the total number of business locations, the number of locations that have achieved 100% profile completeness, locations that have more than 75% completeness for their Core Information, more than 50% completeness for their media, and more than 60% completeness for their business details.

Click on the scorecard tile to view the locations that have achieved profile completeness for the different categories. For example, we’ll Click on the 47 locations that have achieved more than 75% completeness for their Core Information.

The page will then display the 47 profiles that have 75% completeness for their Core Information and the Managed Accuracy score, Profile Accuracy on Directories, number of duplicates flagged and activities carried out.
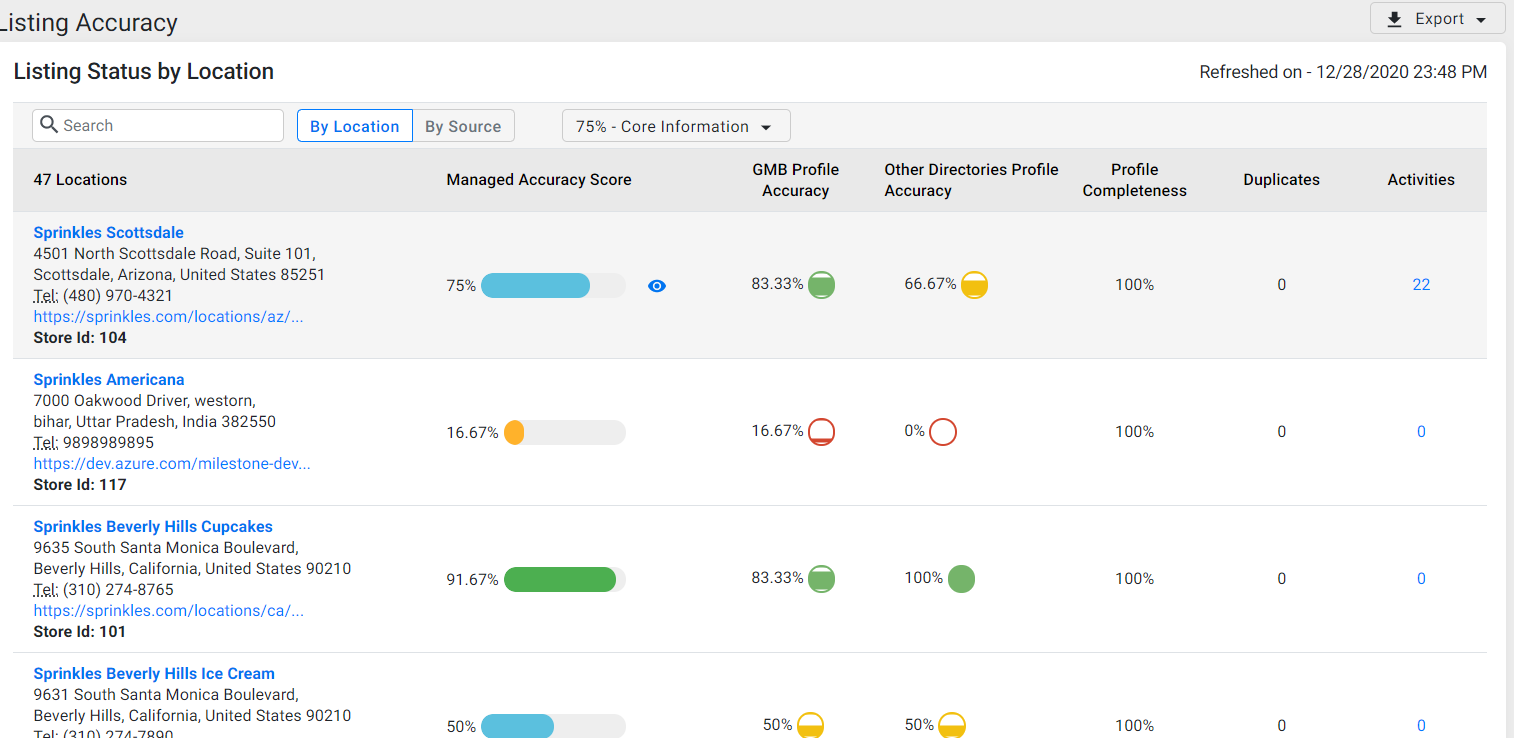
Using the ‘All Locations’ drop-down filter, businesses can view their locations that have 100% profile completeness, completeness of their Core Information (UNAP, Description, Special hours, etc.,) more than 75%, media completeness of more than 50%, and so on.
Click on the ‘By Source’ tab to view the profile completeness data of each directory.

On this screen, using the ‘Sources’ drop-down filter, a business can filter the sources they wish to view the data of fulfillment progress and local statuses (In-sync, In-Progress, etc.,)
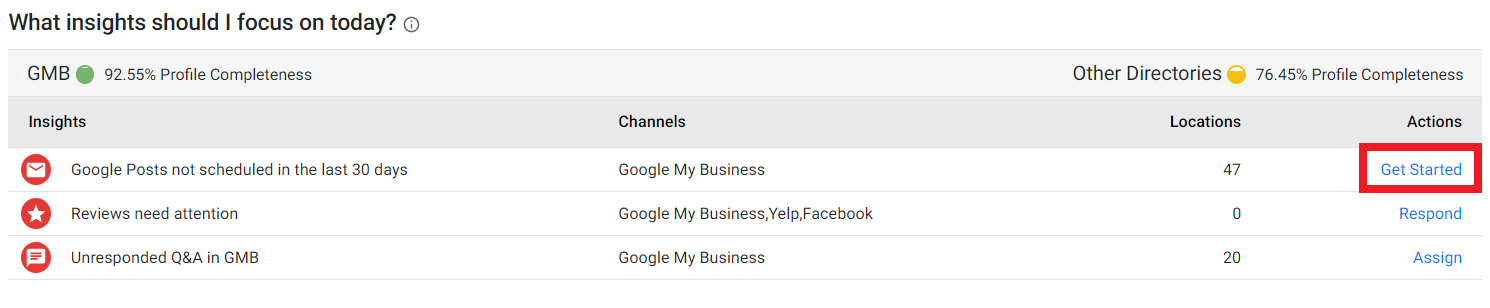
The Profile Completeness widget also displays key insights that businesses need to look into to improve their profile completeness. In addition, businesses have ‘Actions’ that they can carry out by clicking on the ‘Actions’ button.

For example, if the insights highlights state that no Google Post was scheduled in the last 30 days, the business can click on ‘Get Started’ to create and schedule a Google Post.
The business will be redirected to the ‘Post Summary’ screen. Click on 
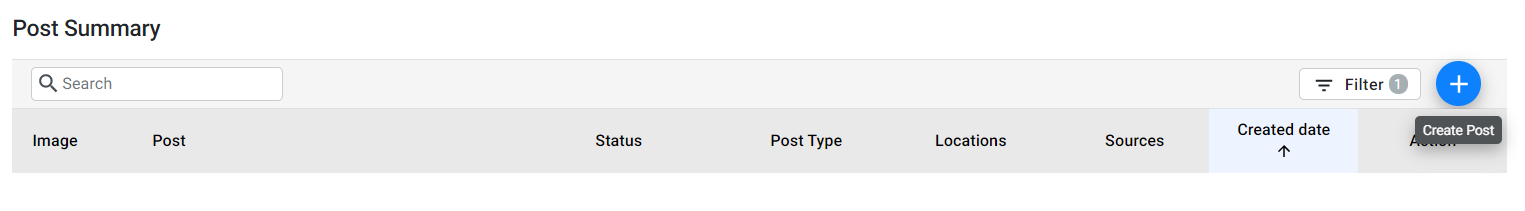
The business can carry out similar actions for reviews, Q&As that need to be responded to, photos, etc.
4. Top 5/Bottom 5 widget hidden when a single profile is selected
If you’re on the Local Performance Summary screen and have selected only a single business location, you will not see the ‘Top 5/Bottom 5’ widget. However, the widget will be displayed if even 2 business profiles are selected.
Here, since only 1 business profile is selected, the widget is hidden.

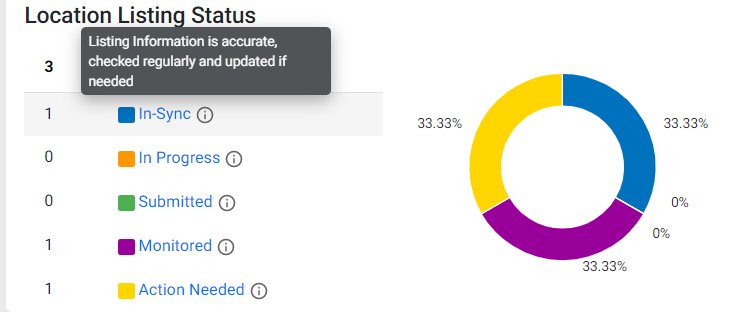
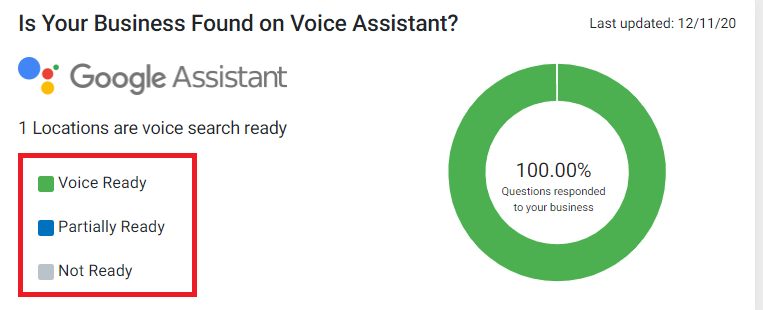
5. Addition of tooltips in the Local Listing Status and legends in the ‘Voice Search Readiness’ widget
To help businesses know the exact definition of the new Local Statuses, we have included tooltips in the Local Listing Status widget.
In addition, we have added color-coded legends to help businesses easily identify locations that are ‘Voice Ready’, ‘Partially Ready’, or ‘Not Ready’.
Schema Manager
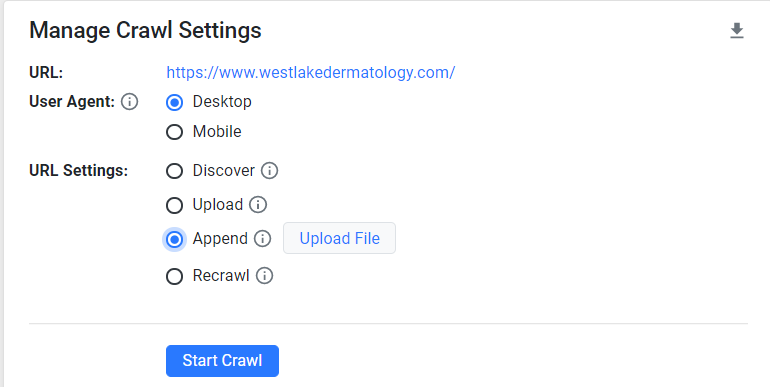
1. Append URLs’ and ‘Recrawl URLs’ options added
Opportunity: Allow the user to add new website URLs and recrawl URLs to ensure that the content is updated
Solution: We have now added the ‘Append URLs’ option to give users the autonomy of adding new URLs to the existing set of URLs that have been crawled. Once selected, click on ‘Upload File’ to append URLs. In addition, the ‘Recrawl URL’ option can be used to recrawl all website URLs and ensure the website content is updated.
In addition, users can recrawl specific pages on the ‘Schema Audit’ page to update the content as per the live version of those pages. To do so, click on the URLs that you want to update and click on ‘Recrawl’.
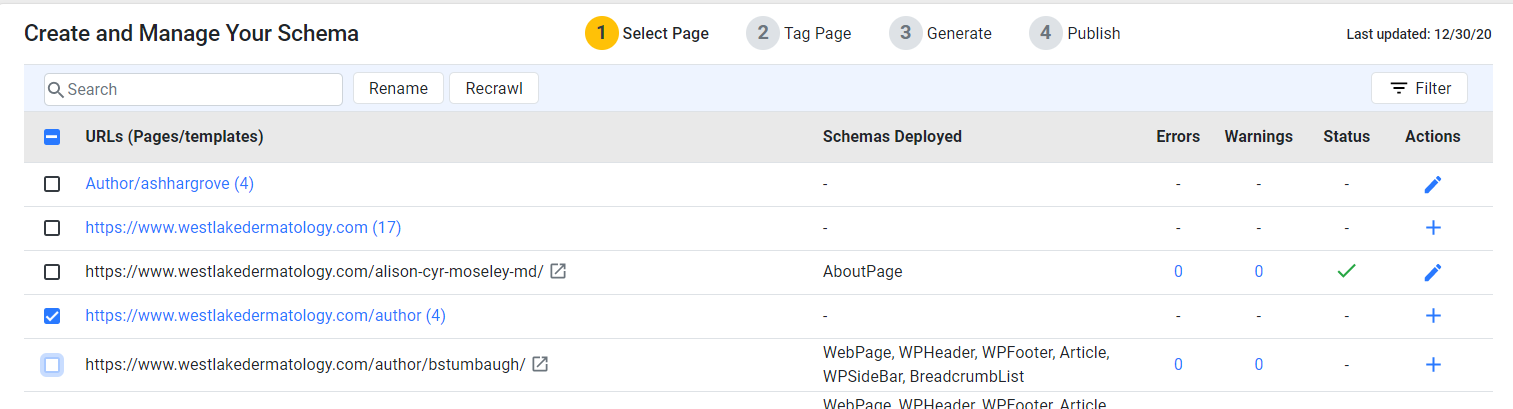
Note: Only once that pages have been crawled can any action of tagging, generating, and publishing of schemas be carried out. Your existing live schema is not affected for recrawled pages. If there is a content update in the pages after recrawl, it is recommended to review and republish the schema so that the web page always has the schema referring to the latest content.
CMS
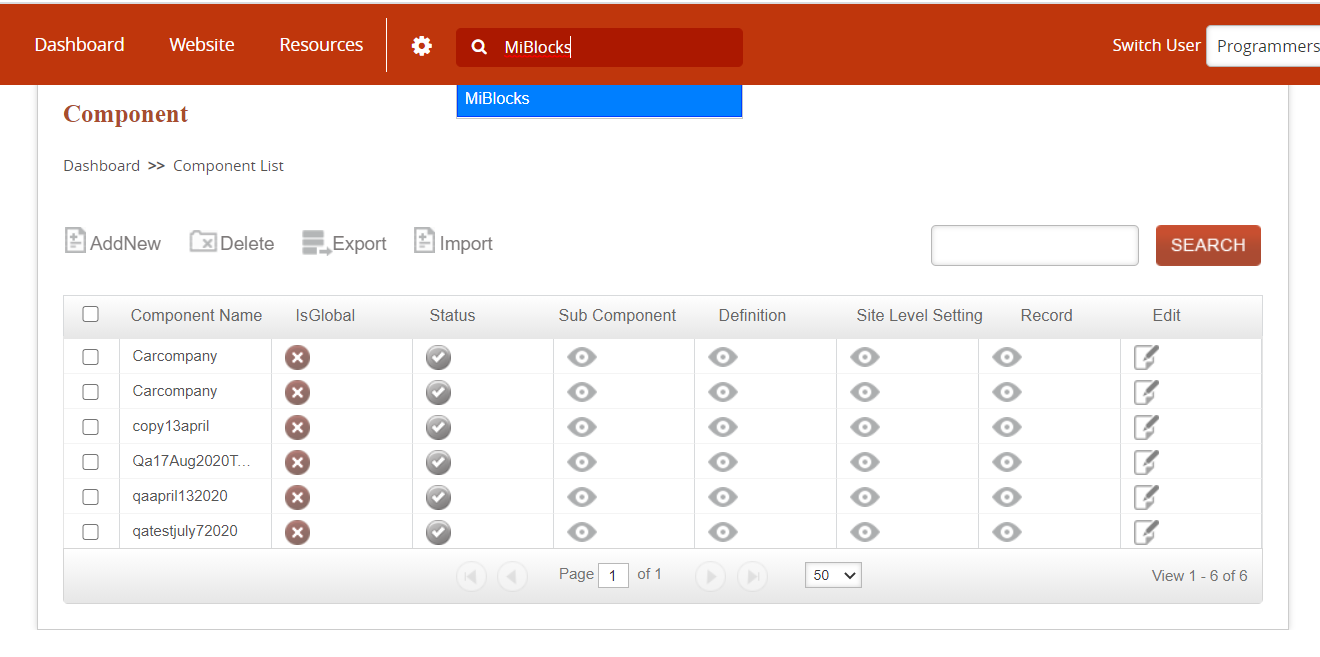
1. Addition of Quick Access search bar in the top navigation
Opportunity: Allow users to quickly find features on Milestone CMS
Solution: Earlier users had to use the left-hand navigation on the screen to find the features that they wished to use which made it difficult for new users to locate particular features on our CMS. The new ‘Quick Access Search Bar’ makes it easy for users (new and existing) to quickly locate the features and carry out functions.

Now, to find any feature, all you need to do is type out the name of the feature on the search bar, and choose the feature you wish to use. For example, if a user wishes to use MiBlocks, all he/she needs to do is to type it out and click on the suggestion that pops up. The page will display the list of MiBlock pages where the user can carry out edits.
Analytics
1. Google Ads – Paid Media Reporting
Business can now analyze the performance of their paid media campaigns on the Paid Media Reporting section on MPC.
Once on MPC click on ‘Reports > Click on the Analytics drop-down > Click on Paid Media Reports – Revenue or Paid Media Reports – Leads.
Currently, Paid Media Reporting covers 2 types of clients:
- Revenue clients: Shows conversion metrics like Revenue, Bookings, ROAS, CPA (Bookings)
- Leads clients: Shows conversion metrics like Leads, CPA (Leads)
Source: Google Ads (based on Paid channels attribution only)
Business can analyze their performance on the MPC UI or choose to download a PDF Report and carry out the following functions:
- Schedule Report for One-time and Monthly basis for single or multiple users.
Click on ‘Export’ and choose ‘Schedule’.
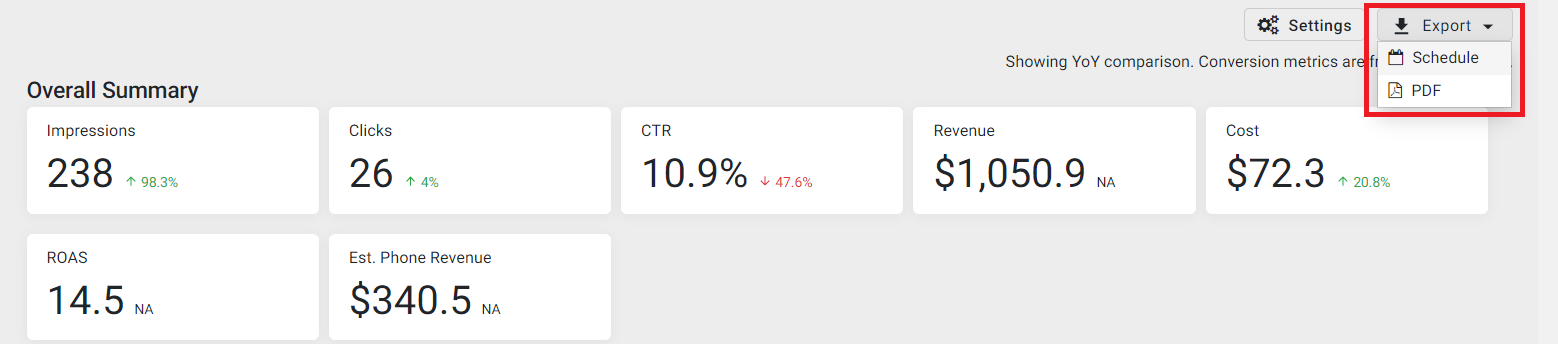
Choose ‘One-time’ or ‘Monthly’. Then choose the date, file type (PDF) and click on ‘Schedule’.

Note: One time and monthly report will always show data for the previous month.
Access reports from Reporting summary or Email notifications.
Businesses can look at their reports either on the Reporting Summary or enter their email ID to receive the one-time or monthly reports.

- Generate PDF or check the data on the UI preview for a single profile at a time.
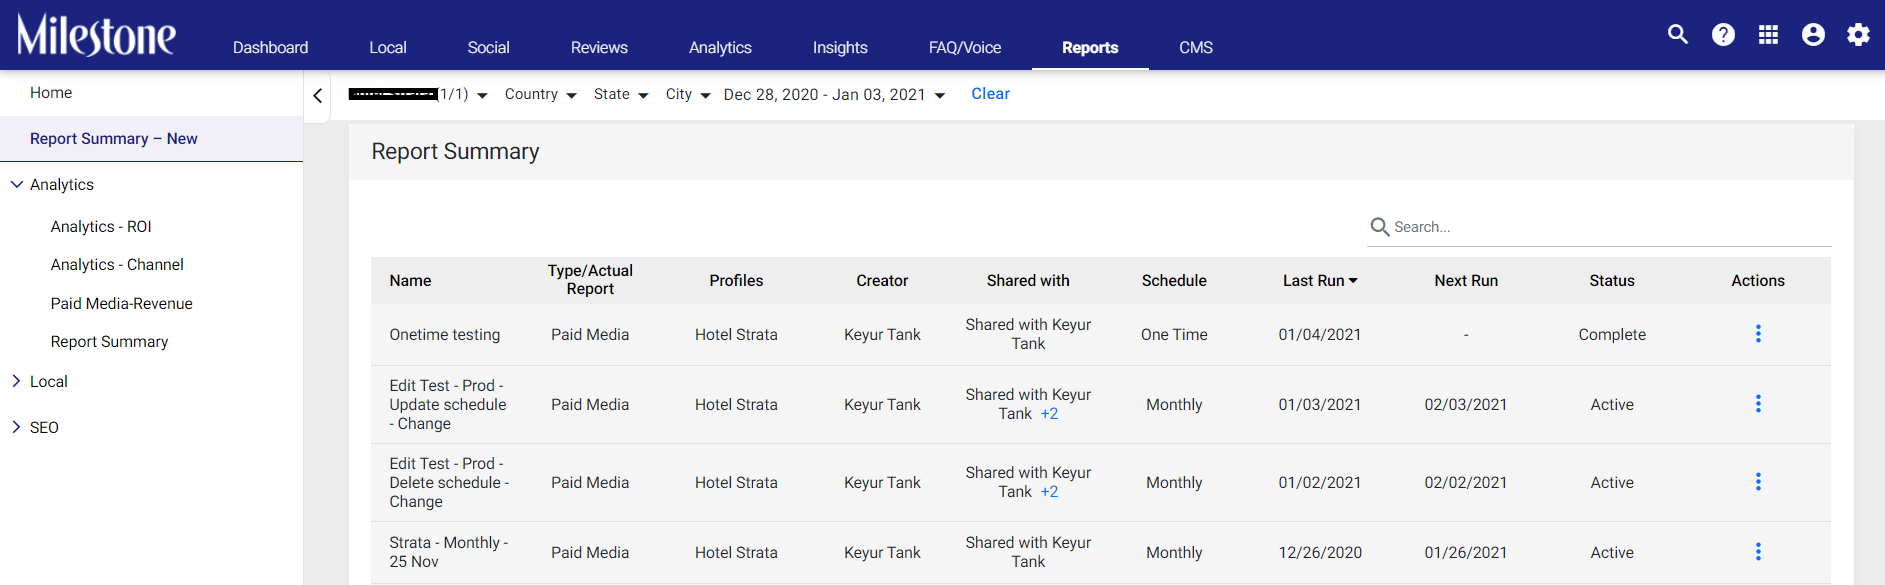
Navigate to the ‘Report Summary’ tab and choose a report you wish to download in the PDF format. Click on the ‘Actions’ button to download a PDF report. You can also click on the report to view the performance on the UI.
Section/Widgets of the Paid Media Reporting – Revenue and Leads
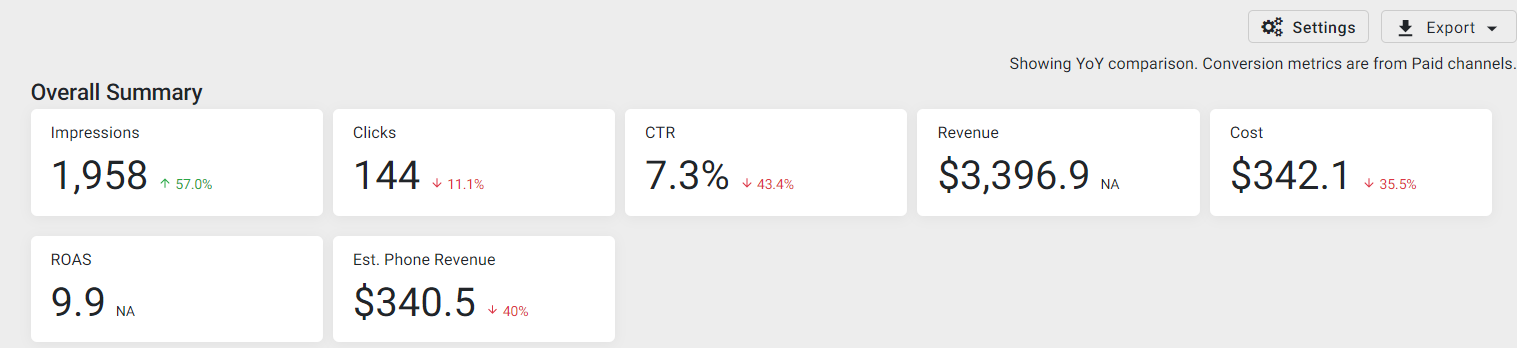
- Overall Summary: Score Cards (Major KPIs)
Paid Media Revenue Reporting:
The report will display key revenue KPIs such as impressions, clicks, Click-through rate (CTR), Revenue, Cost, Rate of Advertisement Spend and Estimated Phone Revenue.
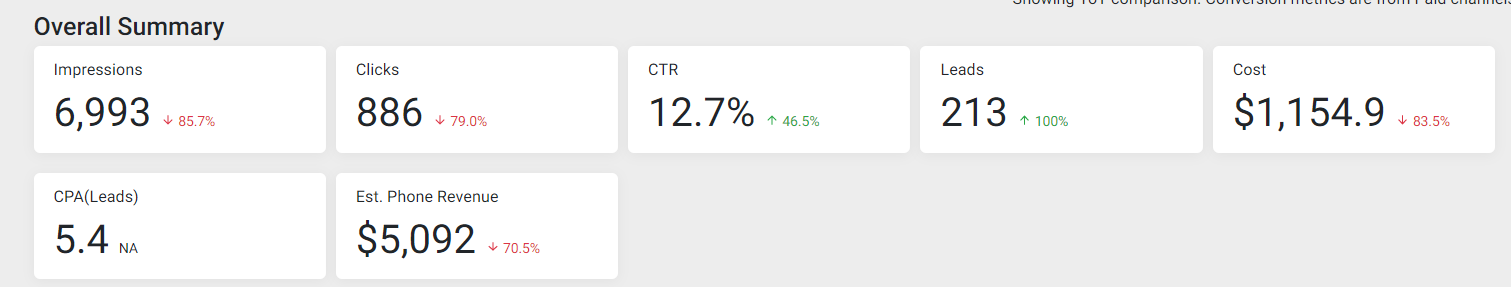
Paid Media Leads Reporting:
The Overall Summary in the Paid Media Leads Reporting will display key KPIs such as impressions, clicks, CTR, leads, Cost of the campaign, Cost per Action (CPA) and Estimated Phone Revenue.
Executive Summary
Displays the Highlights and Opportunities for each business profile for a certain time frame (monthly or quarterly). Users can add summary from MPC Analytics > Executive Summary to show in reporting PDF and UI.

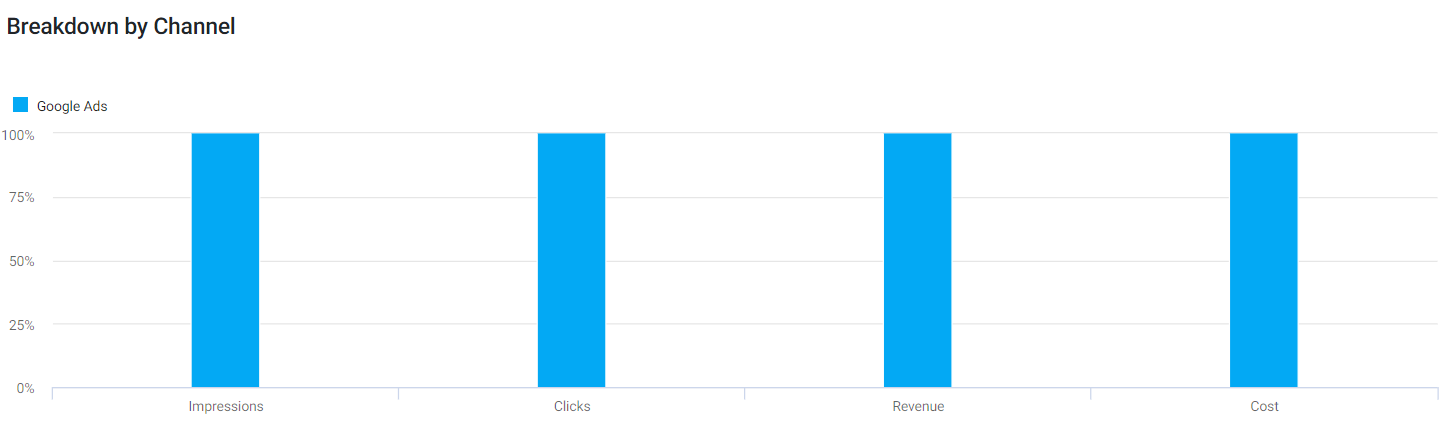
- Breakdown by Channel (Bar chart)
Shows Paid channel contribution in percentage for different KPIs in stacked bar chart.
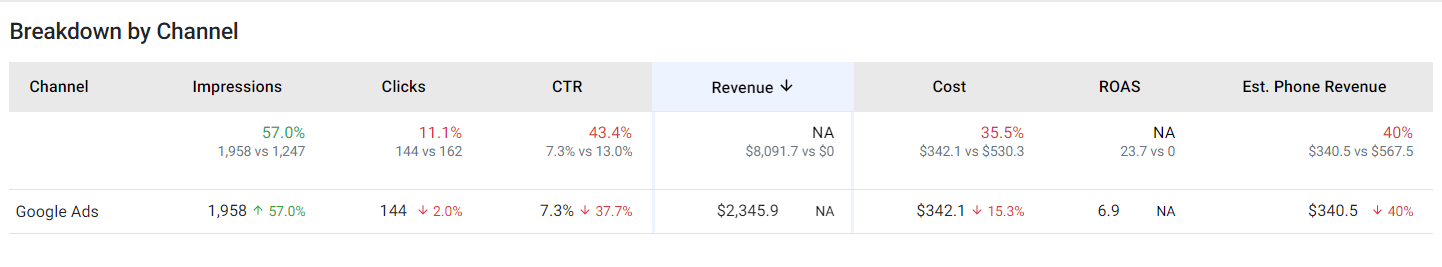
Breakdown by Channel (Table)
Shows Paid channel contribution for different KPIs in the table.
Paid Media Revenue Reporting:
Paid Media Leads Reporting:

Paid Search Google Reporting:
Displays the key Google Ads KPIs and performance metrics for the period selected.
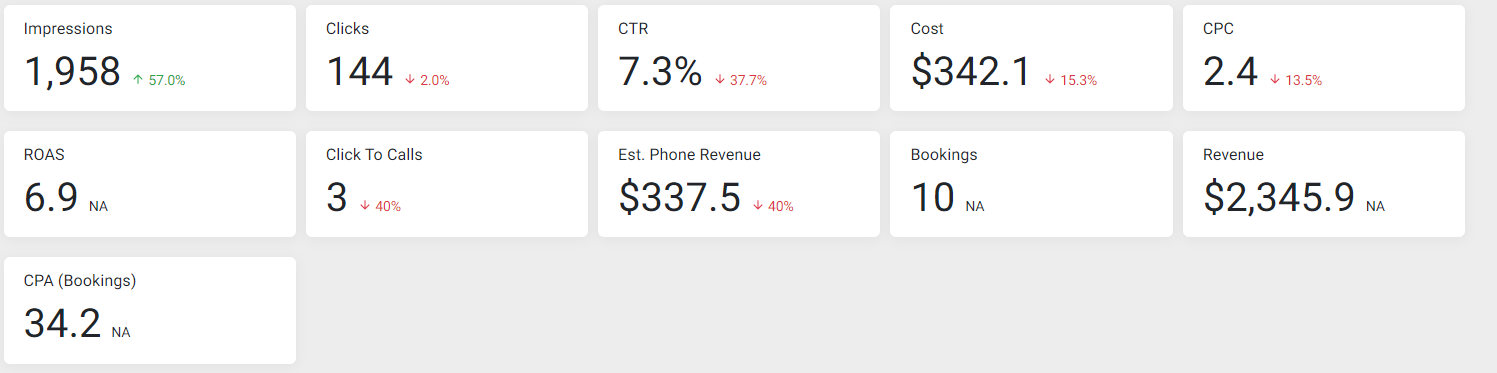
Score Cards (Major KPIs)
Paid Media Revenue Reporting:
Displays major revenue KPIs such as performance, clicks, CTR, Cost, CPC, Rate of Advertisement Spend, Click to calls, Estimated Phone Revenue, Bookings, Revenue, and Cost Per Action.
Paid Media Leads Reporting:
Displays major KPIs such as impressions, clicks, CTR, Cost, CPC, click to calls, Estimate Phone Revenue, Leads, and Cost per Action (CPA).

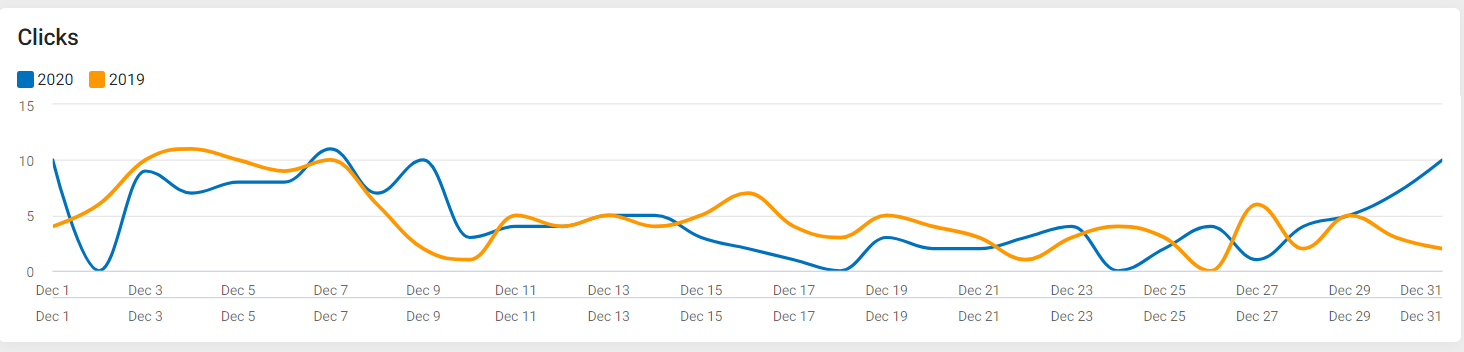
- Website Clicks
- Website Cost
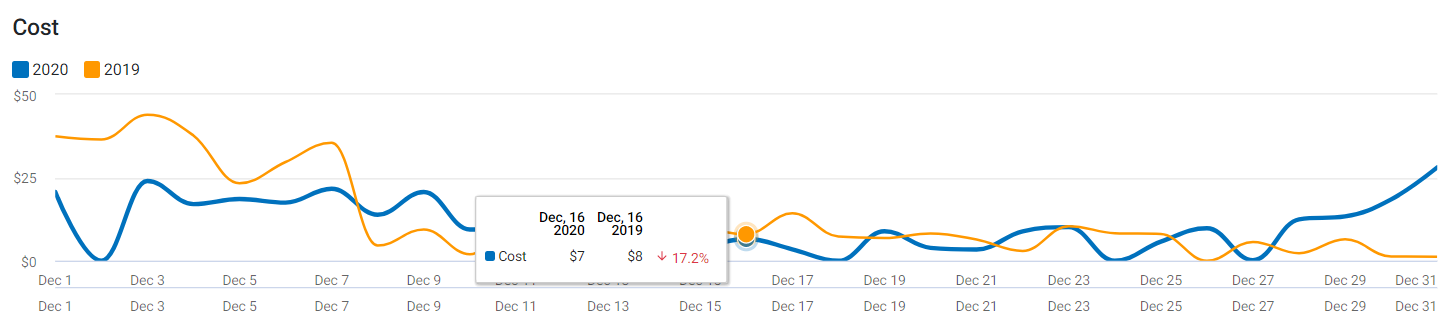
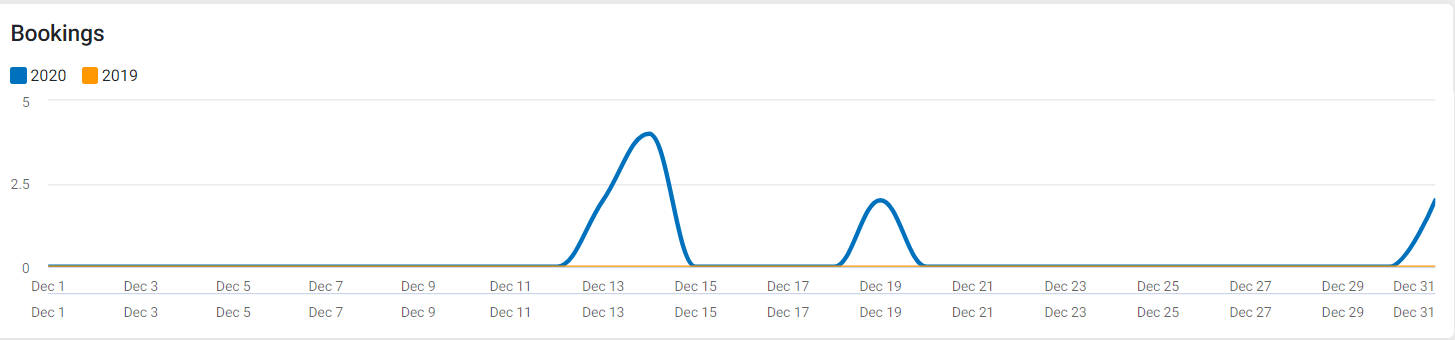
- Website Bookings (Line Chart)
- Website Revenue (Line Chart)

- Revenue by Device (Pie Chart)
Shows contribution of Revenue for different device types

- Cost by Device (Pie Chart)
Shows contribution of Cost for different device types

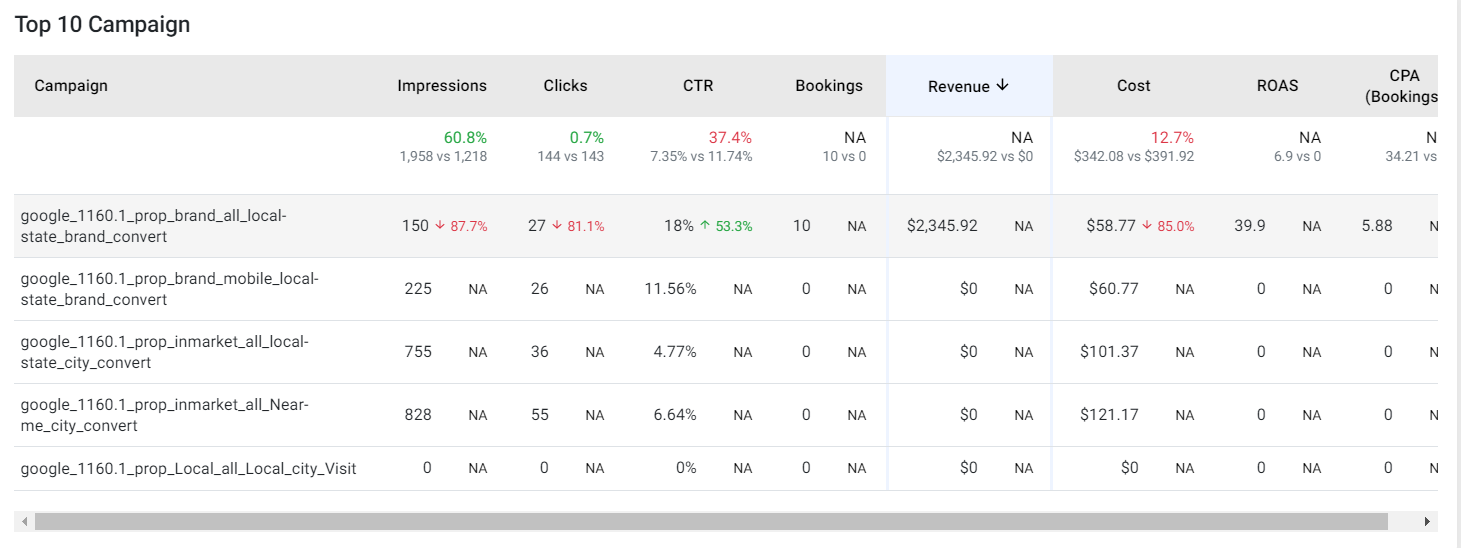
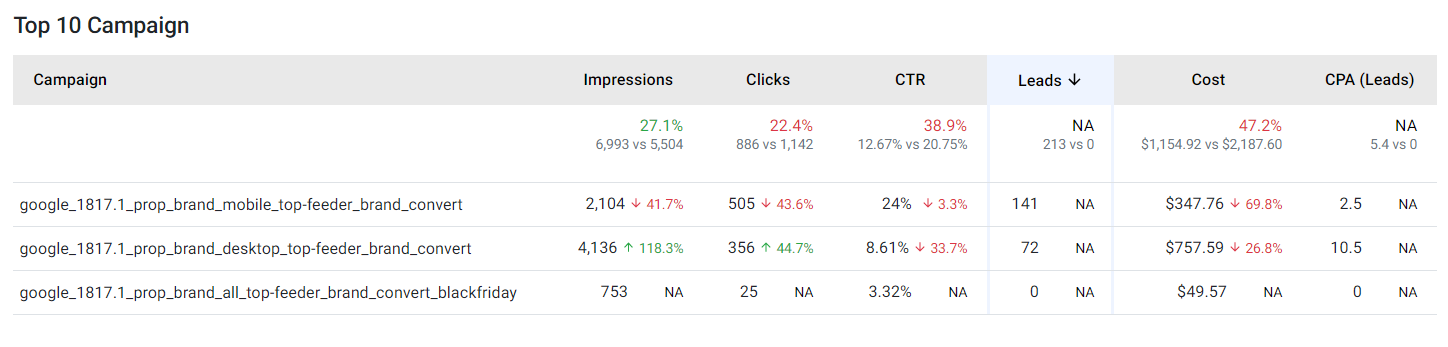
- Top 10 Campaign (Top 10 records in Table)
Shows top 10 campaign performance sorted by Revenue
Shows top 10 campaign performance sorted by Leads
Monthly Performance (Table)
Shows monthly performance for different KPIs with YoY comparison and Total for Paid Media Revenue
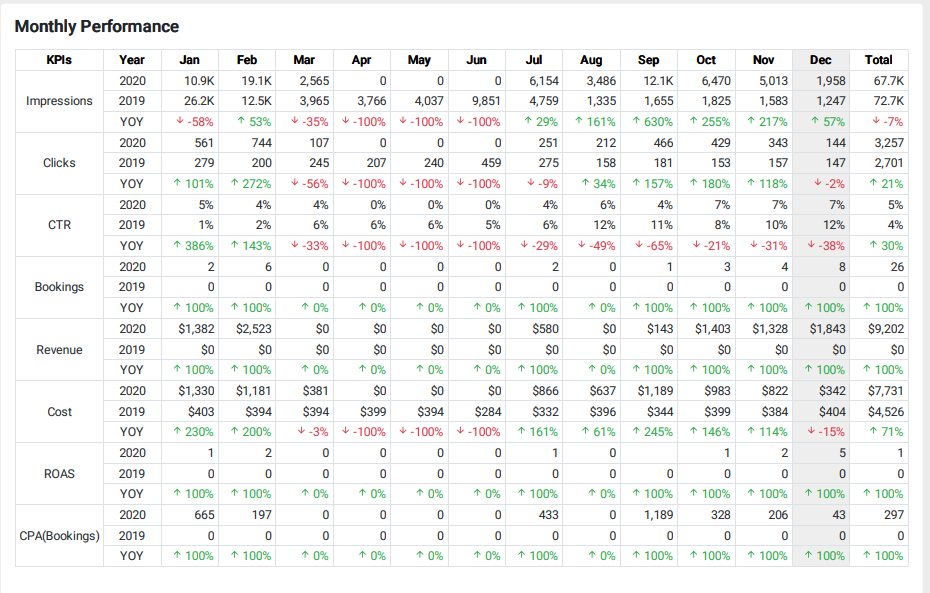
Shows monthly performance for different KPIs with YoY comparison and Total for Paid Media Leads

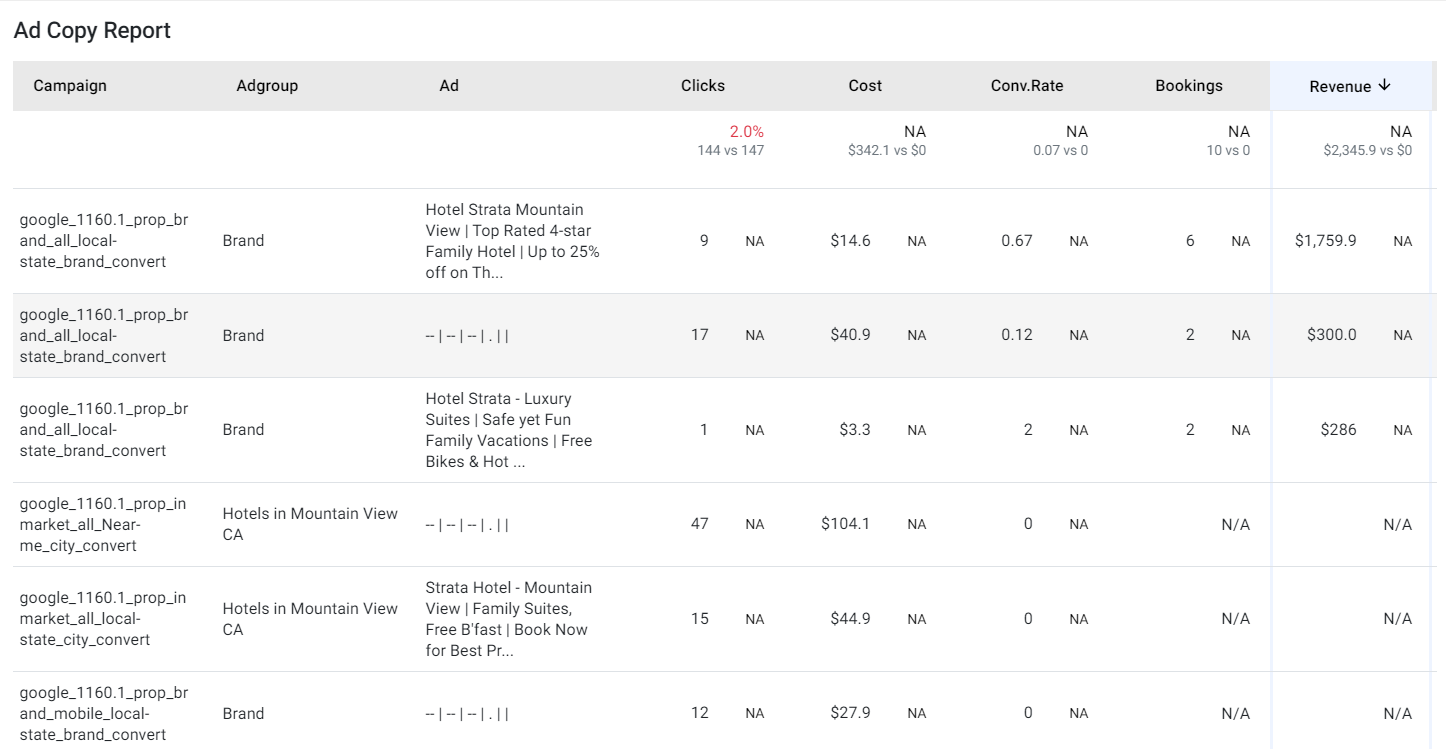
Ad Copy Report (Top 10 records in Table)
Shows top 10 Ads performance for different KPIs sorted by 1. Revenue and Clicks
(in case revenue is 0, the report is sorted based on clicks)
2. Addition of Free form text editor for Executive Summary
When adding an executive summary, businesses can now use the free form text editor. Now the executive summary is not limited to few bullet points under Highlights and Opportunities as you can add any number of points, customize the look and even add images.
Click on ‘Edit’ on the Executive Summary.

You will see the free form editor where you can list the Highlights and Opportunities in numbers or bullets, customize the font and even add images.
