Glossary
Welcome to Milestone Presence Cloud. Once you have logged in using your credentials, click on the ‘more’ button on the Analytics widget.
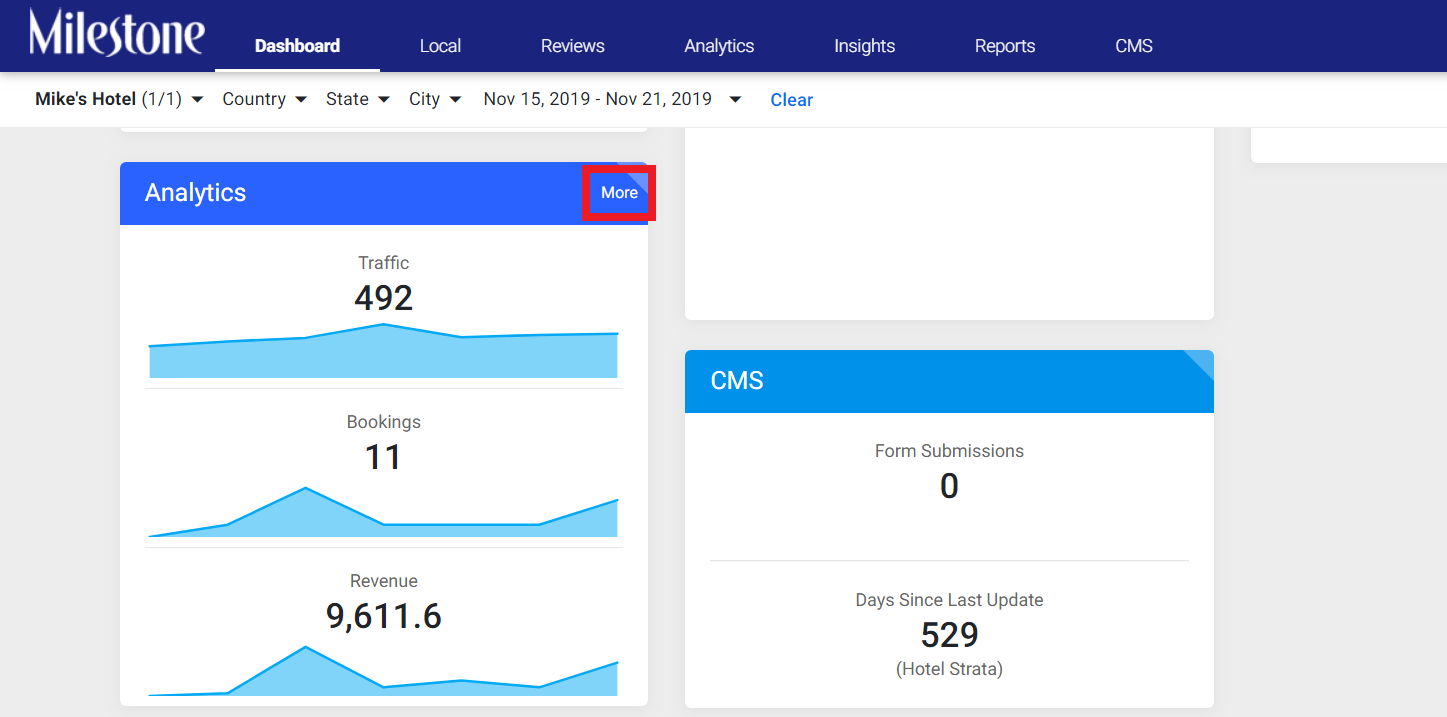
The page will automatically display the Analytics Dashboard. Use the filters to choose the business property and the date range you wish to track the performance for.

Now, let’s explain what each performance metric of the Analytics Dashboard means.


You can use the customize button on top-right of the KPI (Key Performance Indicators) widgets to display the parameters you wish to display for your business. You can choose to display 8 KPI widgets at a time.
Now, let’s discuss what each KPI widget means:
Bookings – Number of bookings your website has garnered for the selected date range
ADR – Average Daily Rate of the Bookings
Sessions – Number of page visitors on your website for the selected date range
Website Leads – Number of filled website forms, clicks, booknow clicks, page views, etc.
Page views - Number of users who have viewed your website
Time on Site – Average time customers have spent on your website
Bounce Rate – Percentage of users who have closed your website page after viewing it or were unable to view it due to slow page speed
Group Leads – Number of request for proposal (RPF) form submissions
Revenue – Total revenue generated by your business on the website during the select date range
Room Nights - Total number of hotel rooms groups take up, multiplied by the number of nights in those rooms
*Bookings, Average Daily Rate, and Revenue Rooms Nights are manually updated to Analytics. The data is fetched either from a booking engine or from Google Analytics E-commerce tracking.
Graphical representation of key KPIs over the date range.
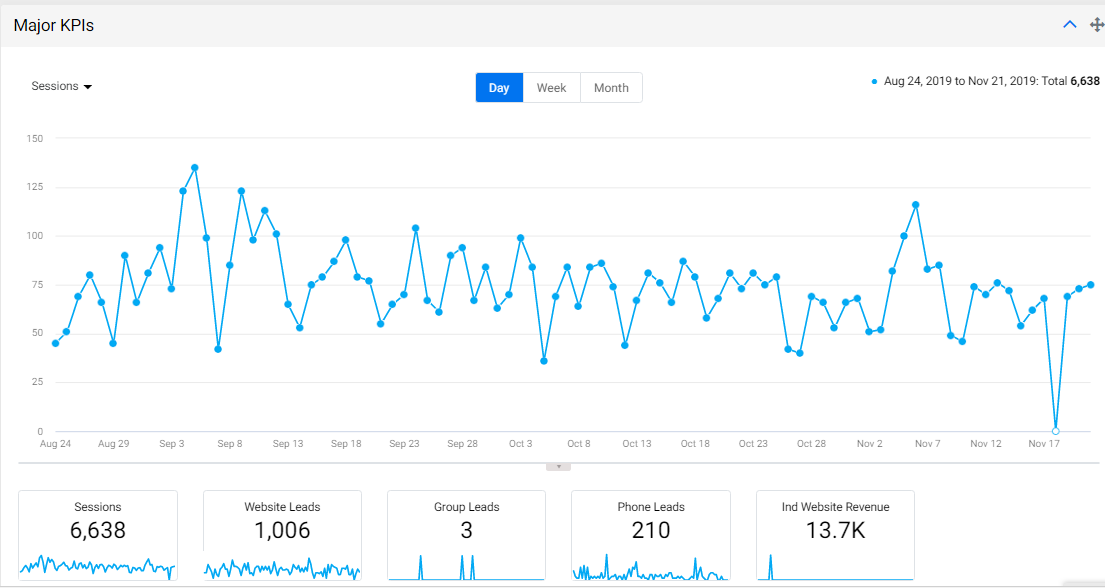
Displays key KPIs such as sessions, website leads, group leads, phone leads and website revenue. Click on a particular KPI widget to view the graphical representation.
On-Page KPIs
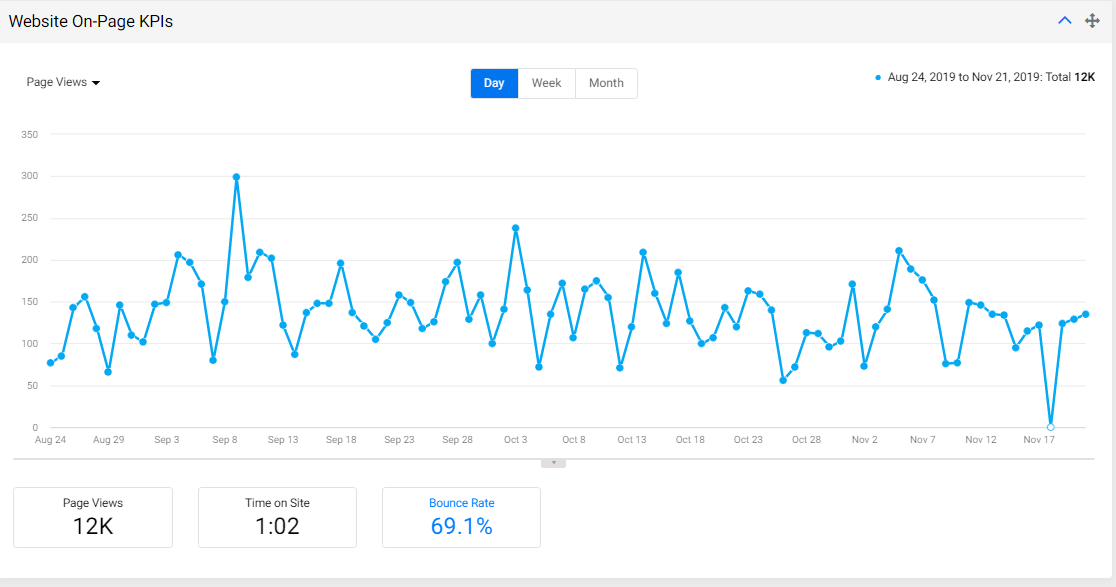
Displays on-page KPIs such as page views, time on site and bounce rate. Here too, click on the KPI widget you wish to view.
Google Pay-Per Click Savings

Here you can view the branded and non-branded keywords that got the most clicks. Displayed are the total clicks for each keyword, the cost per click you would have spent (on Ad campaigns) and your total savings using our organic keyword insights.
Paid Marketing Campaigns
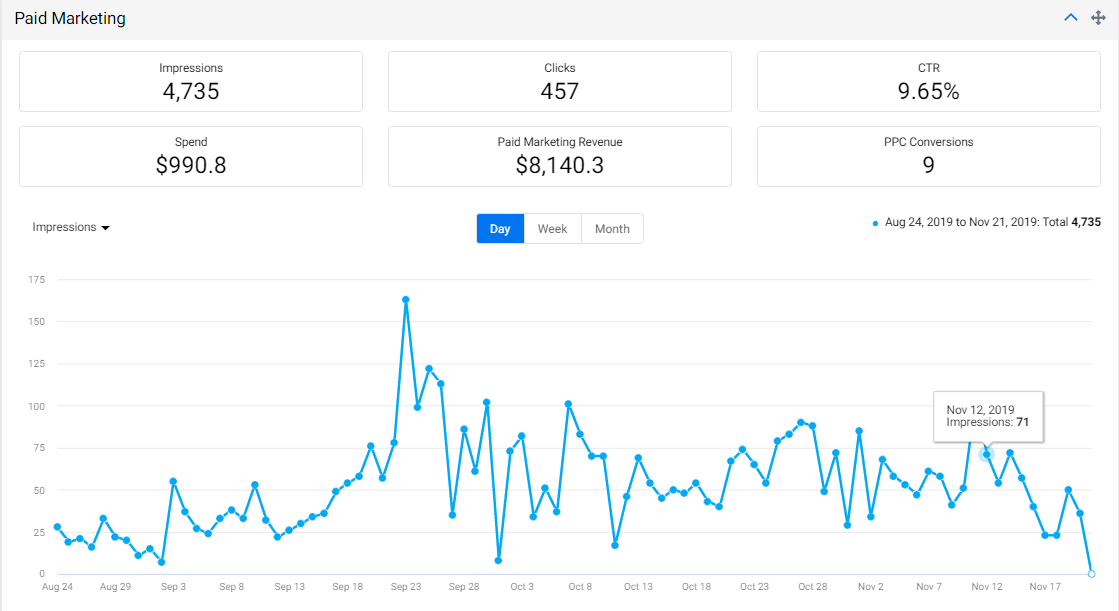
The Paid Marketing widget displays the performance of your website’s Google Ads and Bing Ad campaigns. The widget will display the total impressions that your website got during the course of the campaign, the number of clicks, average Click Through Rate (CTR), your total Ad campaign spend and the revenue your business generated from the campaign. The Pay per click (PPC) conversions or leads generated from the campaign from other sources (third-party websites) will be displayed as well.
Traffic by Device Type
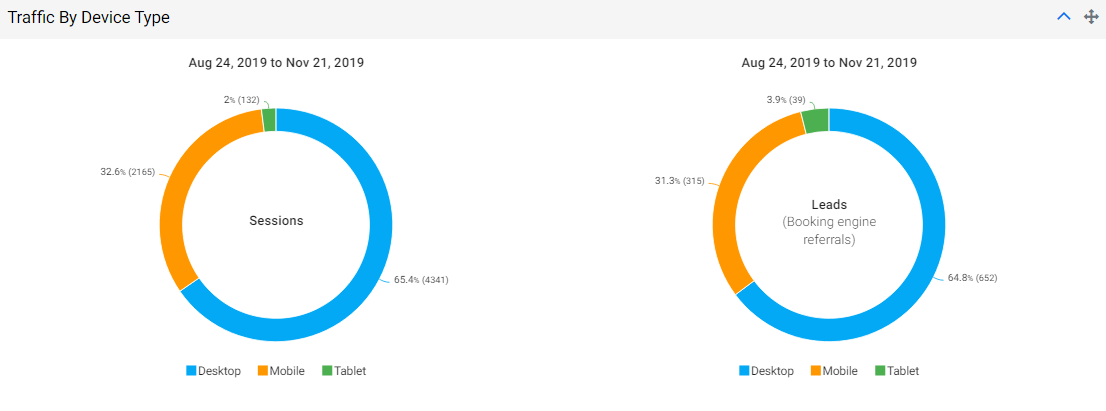
As the name clearly states, the Traffic by Device widget displays the traffic generated from different devices – Desktops, Mobile devices and tablets. The widget will display the sessions of each device and the leads generated from referral booking engines on each device.
Traffic by Source
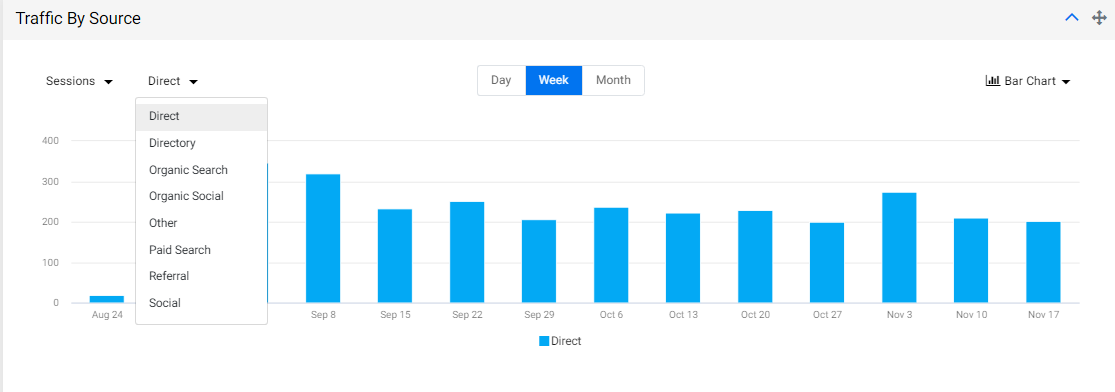
This bit of the report will display the sessions of the business website for the selected time duration either through direct traffic, directories, organic search, organic social traffic, other sources, paid search, referral sources and paid social campaigns.
Traffic by Geography

This widget displays the traffic based on select geographical locations – cities. You can use the filter to choose the traffic from certain geographical locations that you wish to track.
Traffic by Referring Domains

This widget displays the traffic received directly on your website and traffic directed from referring domains such as Google, Bing, Yelp, Yahoo, Facebook, etc. The sessions, page views, and time on site from each referring domain will be displayed.
Social Contribution (Paid and Organic)
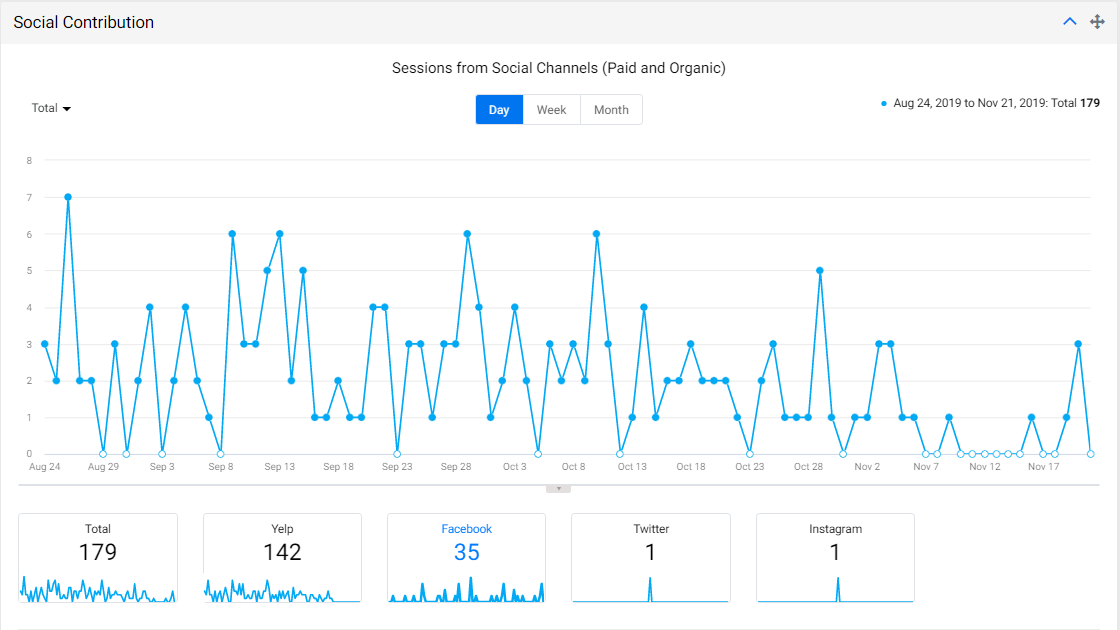
This displays the traffic generated from social channels in the case of organic search as well as paid campaigns. The total session will be displayed as well as sessions generated from social channels such as Yelp, Facebook, Twitter, Instagram. You can use the filter to choose the social channels you wish to track.

This displays the total leads generated from social channels.
Blog Traffic

The blog traffic widget is particularly for customers that Milestone provides blog services. The data is fetched from Google Analytics and customers can review the total blog sessions, page views, time on each page and conversions from the blogs published on your website.
Goals Conversion Rate

This displays the total goals complete for the select time duration and the goal conversion rate. Here, the different booking buttons of your website are tracked.
Top Event Count
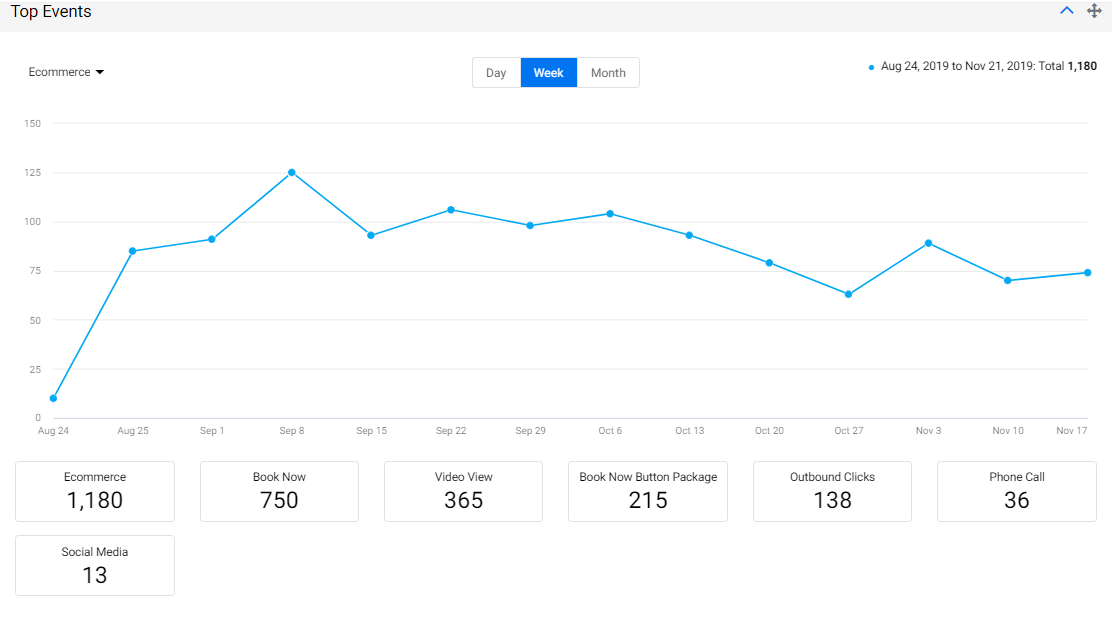
This widget displays the unique event count from different sources on the website, outbound links, E-commerce, Book Now, Video View, Book Now Button Package, Outbound Clicks, Phone Calls and Social Media.