Release: Apr 26, 2021
Schema Manager
1. Potential Cost Savings Report
Opportunity: Display the value of schemas with regard to visibility on search against the amount you would have spent on ads to achieve the same clicks and impressions
Solution: We’ve introduced the Potential Cost Savings Report that shows the potential dollar value saved by deploying schema against a similar click gain using paid campaigns.
Schema > Search Performance > Potential Cost Savings Report
The Potential Cost Savings Report displays the savings of your business just by implementing the right schemas on your webpage versus what you would have to spend for a paid campaign to achieve the same number of clicks and impressions on search.
The
Potential Cost Savings Report automatically displays data of the
period selected against the same period the previous year. The
widget displays the potential cost savings along with the total
number of impressions and clicks for the period selected.
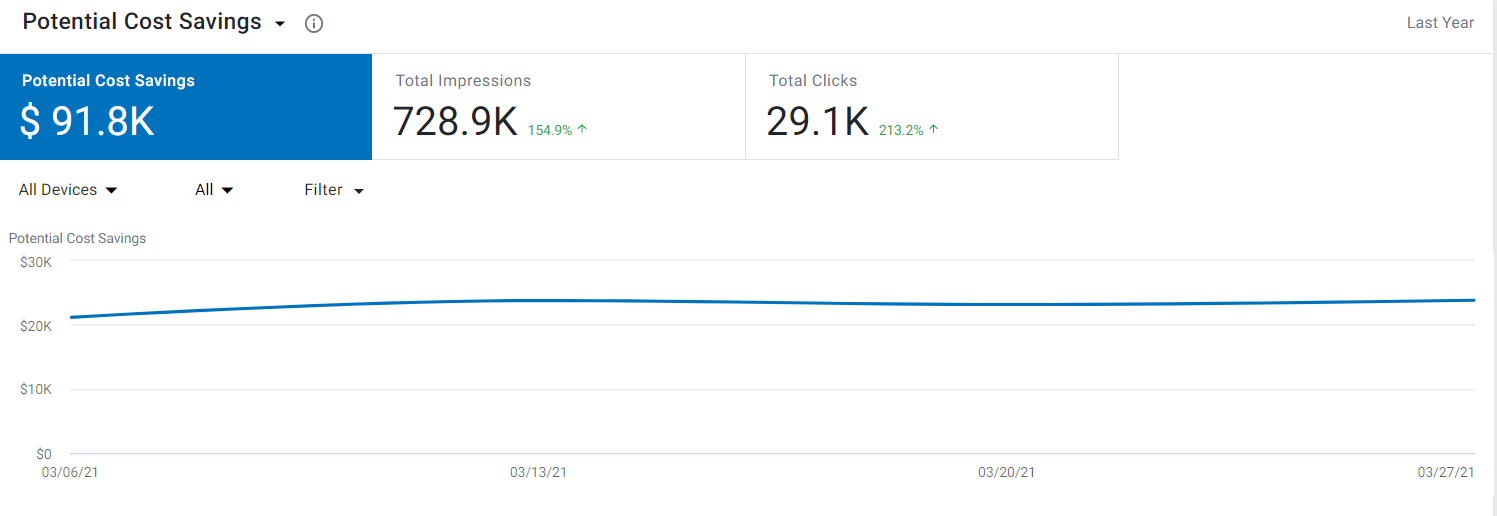
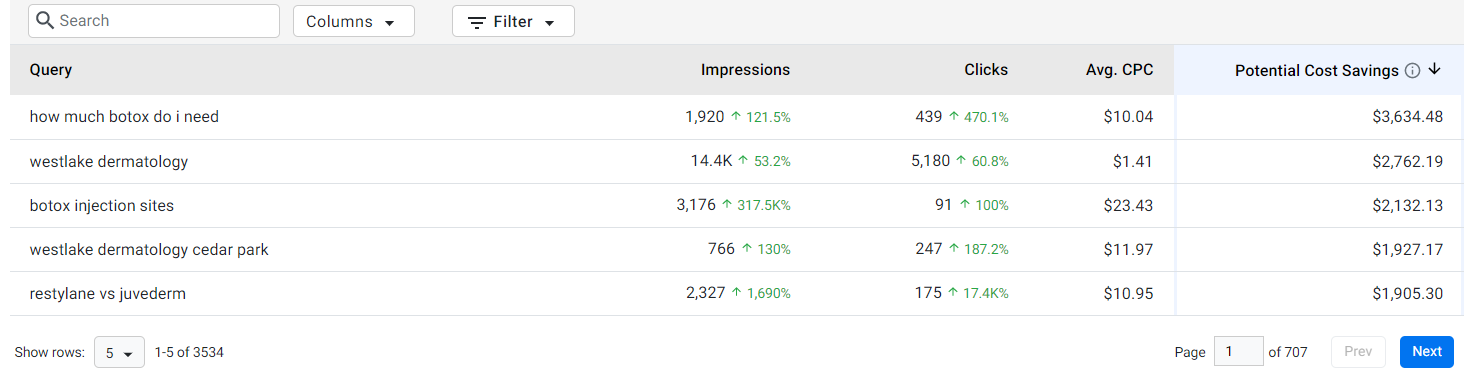
You will also see the queries on search with the total number of clicks, impressions, Cost per click (CPC), and the Potential Cost Savings.
Calculation:
The Potential Cost Savings is calculated based on:
1. Incremental click value of an existing/ new keyword. (This represents your potential click gain due to schema deployed.)
-
Keyword
Clicks in March 2020
(A)Clicks in March 2021
(B)Incremental Click Value
(B-A)Green Earth
25
75
50
Mother Earth*
-
100
100
*New Keyword
2. Latest Cost per Click (CPC) value of that keyword. (This is what you would have paid for each click of these keywords if this were a paid campaign)
-
Keyword
Latest CPC
Green Earth
$2
Mother Earth
$1
3. Deriving incremental savings for that keyword using Incremental Click Value and CPC (This is what you potentially end up saving for each keyword for all the clicks that you gained due to schemas during the period)
-
Keyword
Latest CPC
(A)Incremental Click Value March 2021
(B)Incremental Savings
(A * B)
Green Earth
$2
50
$100
Mother Earth
$1
100
$100
4. Summing up the incremental savings for all the keywords to get the overall Potential cost savings. (Finally, your overall potential cost savings across all eligible keywords – existing or new)
-
Keyword
Latest CPC
(A)Incremental Click Value March 2021
(B)Incremental Savings
(A * B)
Green Earth
$2
50
$100
Mother Earth
$1
100
$100
Overall Potential Cost Savings
$200
Note:
- The potential cost savings report can be derived for only for pre-defined date ranges at this point.
- This report is generated based on the last average cost-per-click (Avg. CPC) values as available from Google AdWords up to a week prior to report generation date.
2. Schema Loader Script Tracking Notification
Opportunity: Notify users to verify and embed schema loader script on the webpage URL to ensure that the web page can pull in the schema. Json published from Schema Manager relevant for that URL and to remove any pre-existing schema on the URL.
Solution: On the Schema Audit Page, you will now see a notification of the URLs that require the schema loader script.

Click on ‘‘X’ URLs’ on the notification to view the URLs that require the schema loader script.
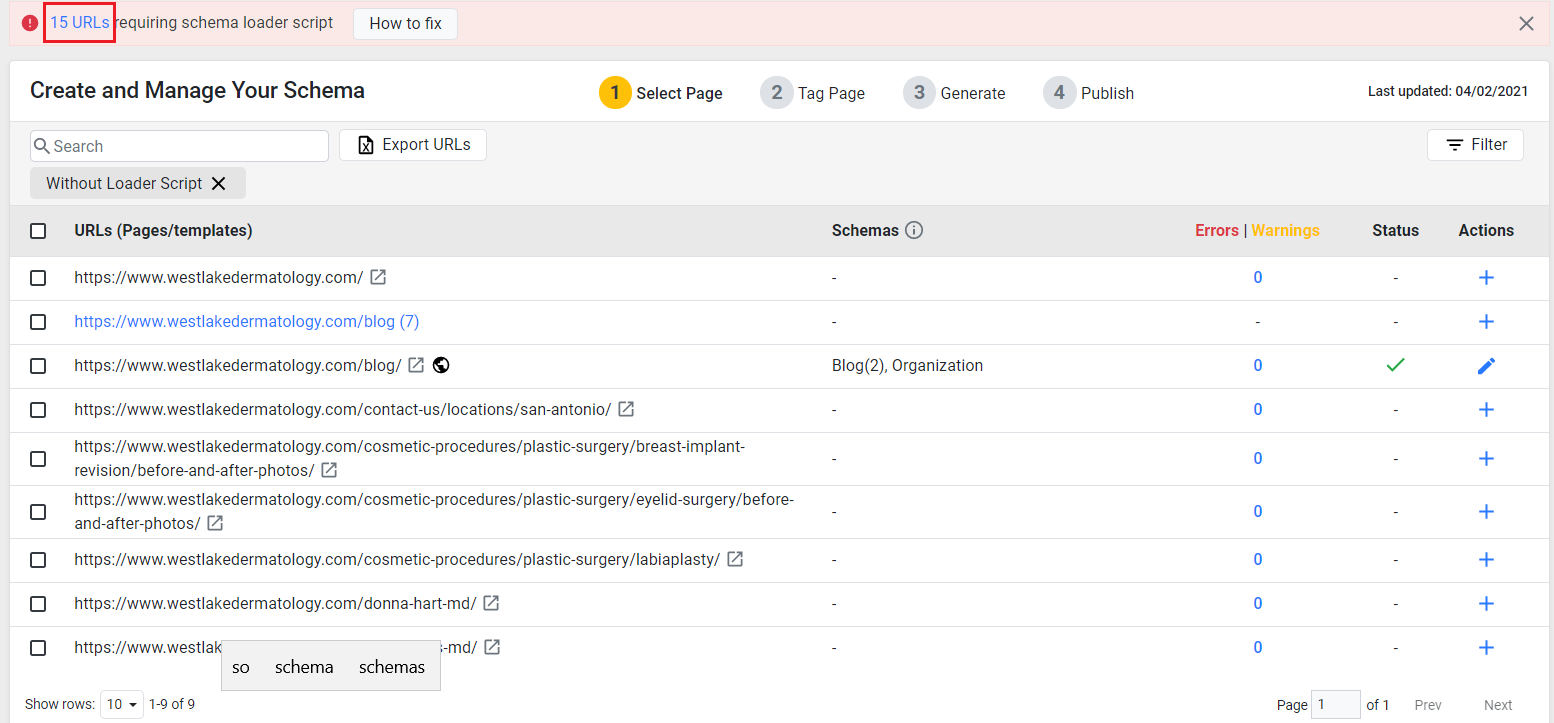
Click on ‘how to fix’ to know how you can embed the schema loader script to your web pages.

Local & Reviews
1. Upload and fetch competitor social audit report for multiple locations
Opportunity: Reduce workload and improve performance by allowing users to upload and fetch competitor social audit data for multiple locations and not for just a single location
Solution: Using the bulk upload functionality we can now upload the comp social audit data for multiple locations and view the status of the files
Path: MPC > Choose profile locations > Reports > Competitive Social Audit
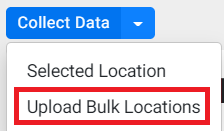
To get started, choose ‘Upload Bulk Locations’ from the ‘Collect Data’ drop-down.
To ensure that the file uploads successfully, first click on the ‘Download Sample File’ and enter the data of the locations in the correct format (Profile Alias, Profile Name, and External Alias) based on the sample file.
Next, click on ‘Choose File’, select the file with the data of the locations and click on ‘Upload’.

You will then see the status of the uploaded files under the ‘Status’ column - In Progress, Partially Uploaded, Upload Completed.
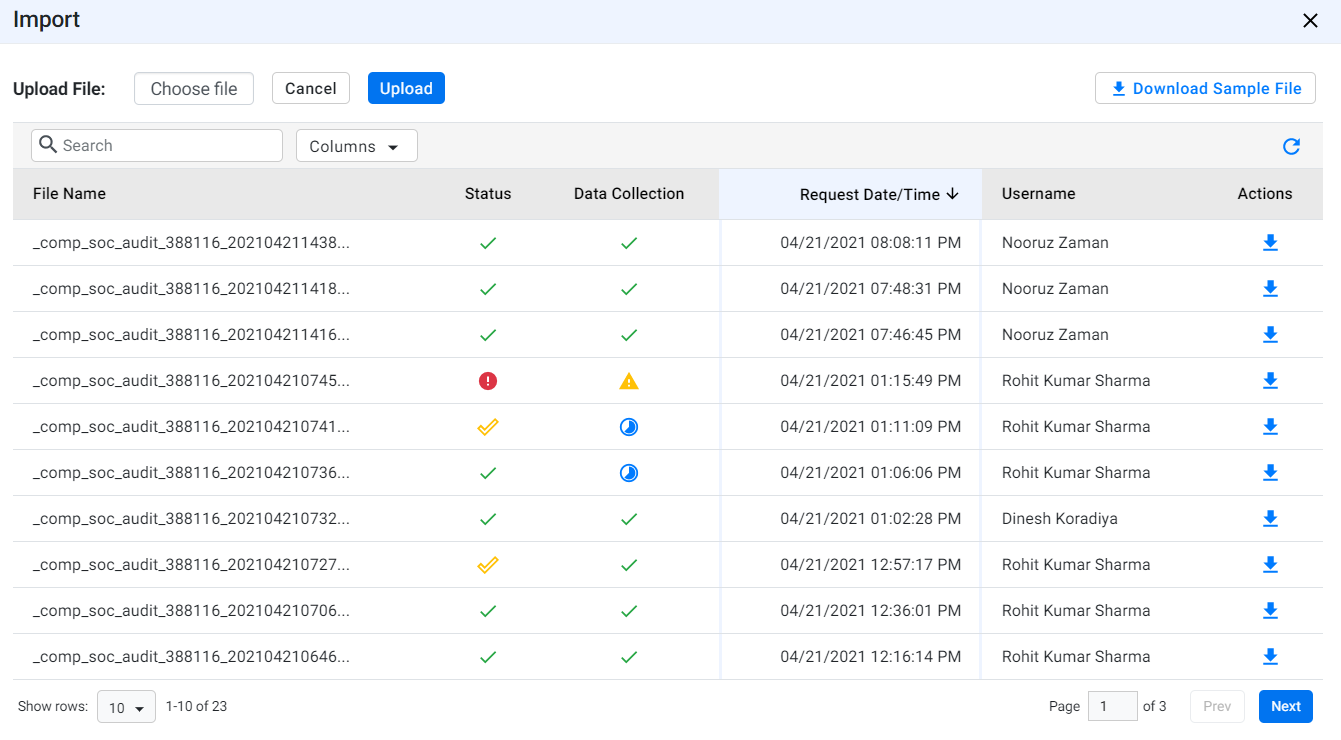
Once the upload is successfully completed, we will automatically trigger the request to fetch the data for competitor social audit report for all the uploaded locations. You can view the status of your data fetch in the same pop-up under the ‘Data Collection’ Column - To-do, In-Progress, Completed.
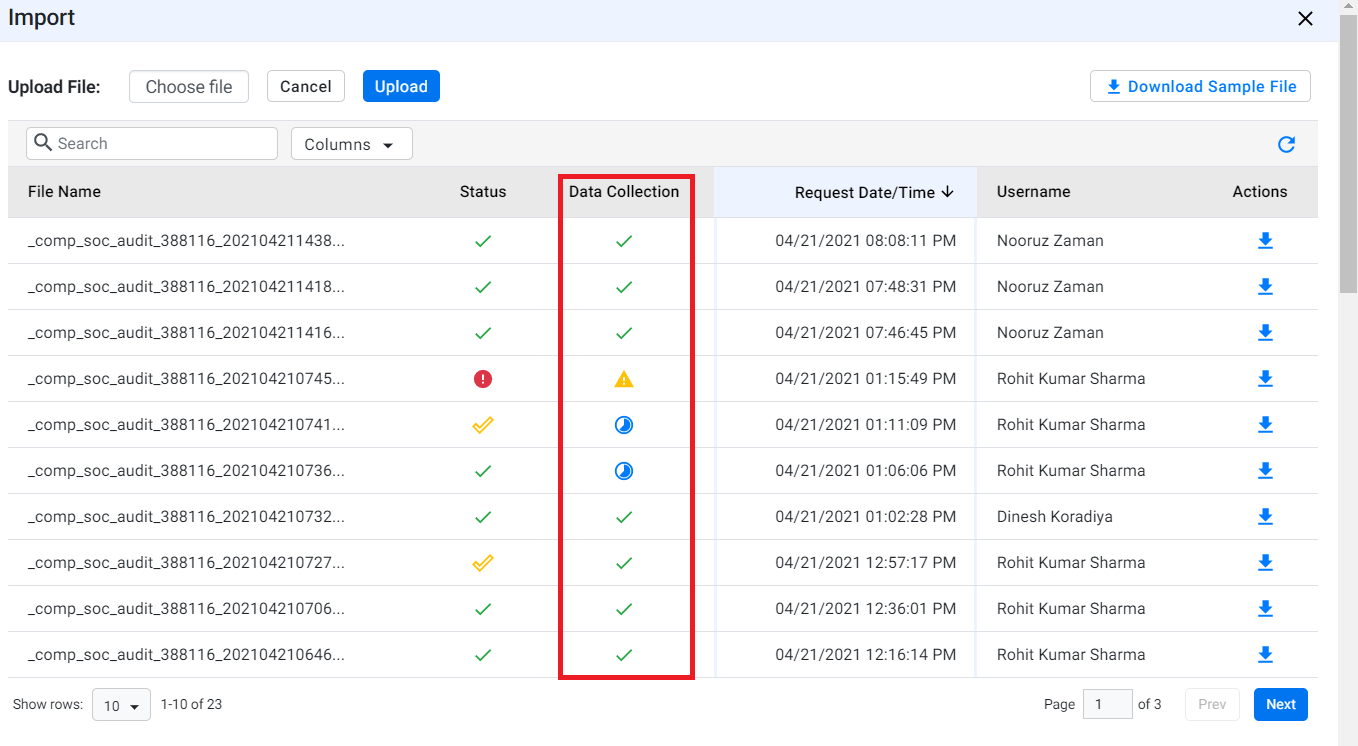
Once the data collection is complete you can proceed to view the data of the locations you uploaded by clicking on the download button under the ‘Actions’ column.

2. Baidu Partnership
We’ve partnered with Baidu and can now monitor the name, address, and phone number of the business listings on the platform.
Analytics
1. Digital Performance Report
Opportunity: Offer a consolidated report for a business’s paid media, organic, local, and website performance.
Solution: The Digital Performance Report is an automated omnichannel performance report that encapsulates the digital performance of a business location across direct (website), organic, local, paid channels.
Available for revenue and non-revenue clients, the Digital Performance Report compares the performance of the business location in the current month against the same period the previous year and includes configurable hard conversions to suit different verticals. In addition, it displays E-commerce revenue (as set up on GA), each channel’s summary and breakdown by sub-channels/sources, and offers report automation through the scheduling option.
MPC > Reports > Analytics > Digital Performance – Detailed
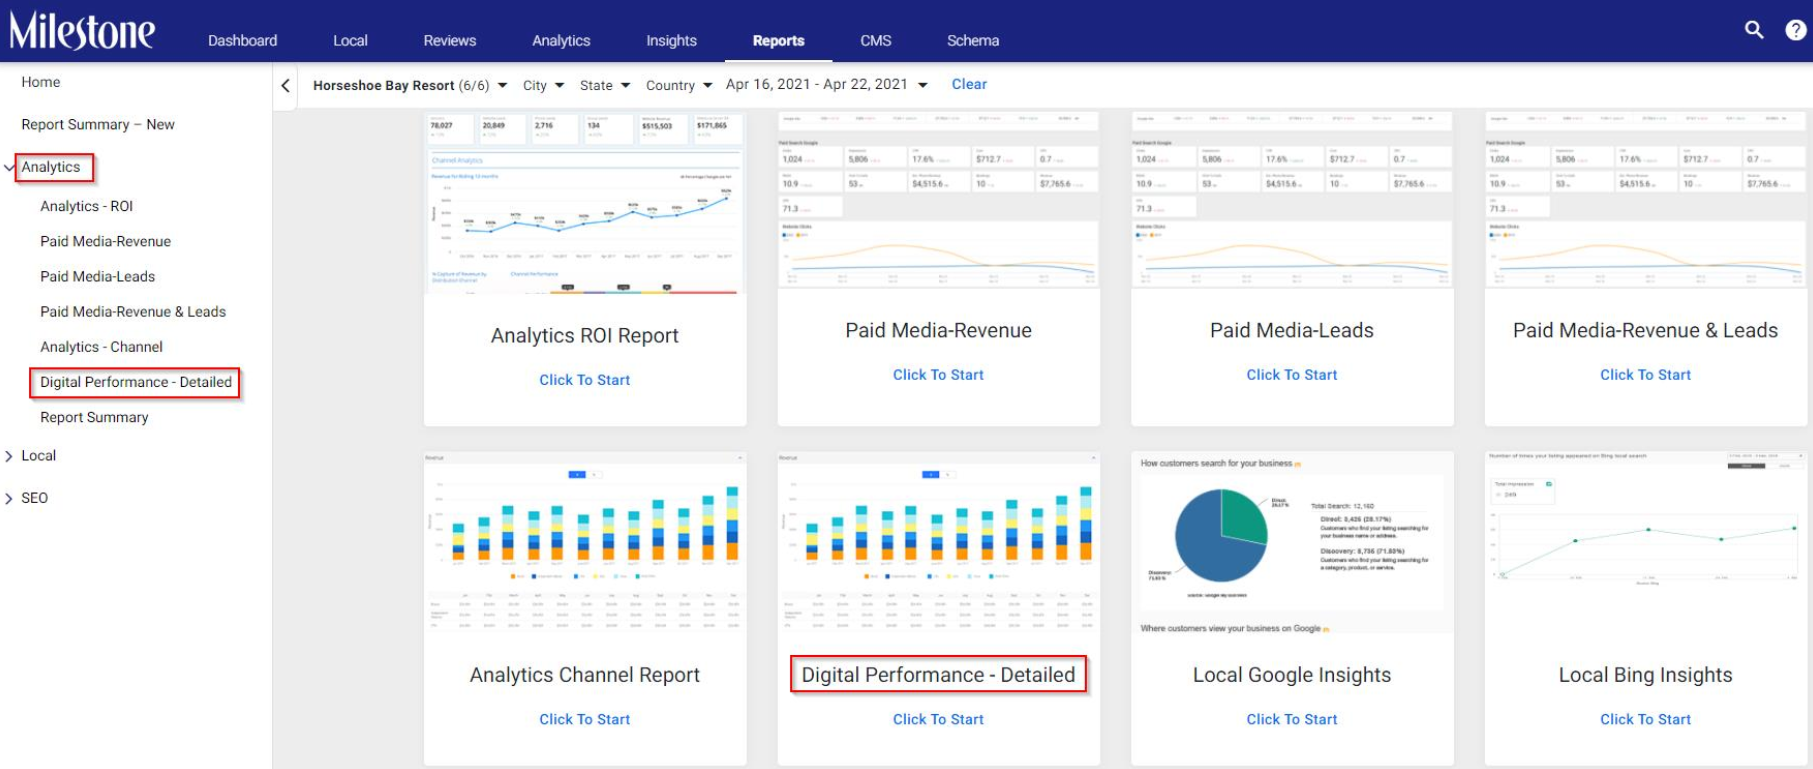
Let’s take you through the key screens of the Digital Performance Report:
I. Overall Performance
Includes performance of the business location across all channels. The overall performance showcases key metrics, executive summary, overall revenue (if applicable) and by channel and device, bookings, total hard conversions, group leads, and sessions.
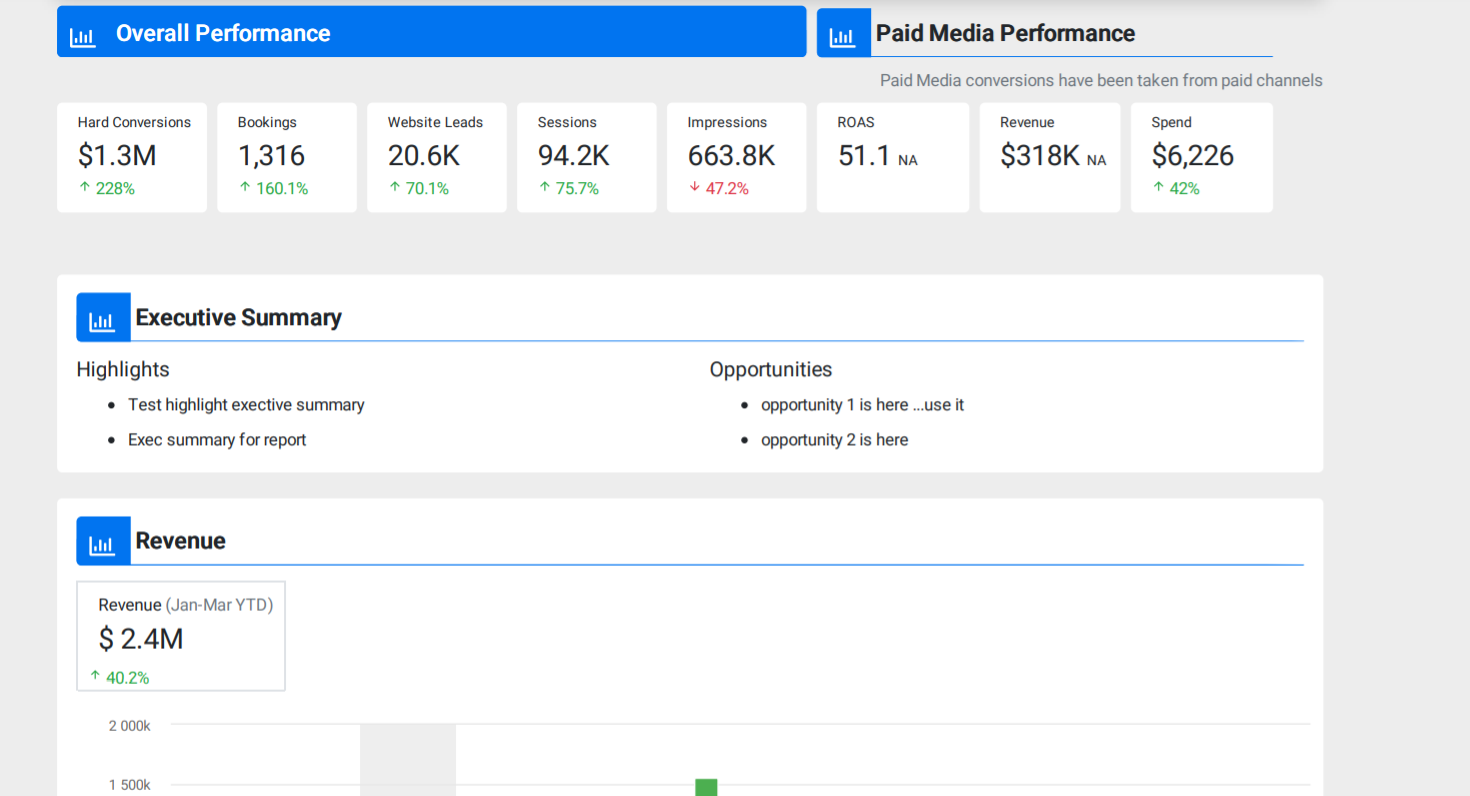
ii. Paid Media Performance
The Paid Media Performance section displays the key performance metrics of paid campaigns on channels such as Google, Meta, Facebook and Bing. It showcases the overall revenue generated from the paid campaigns across all channels, Return of Advertisement Spend (ROAS) and a performance comparison across all paid channels.

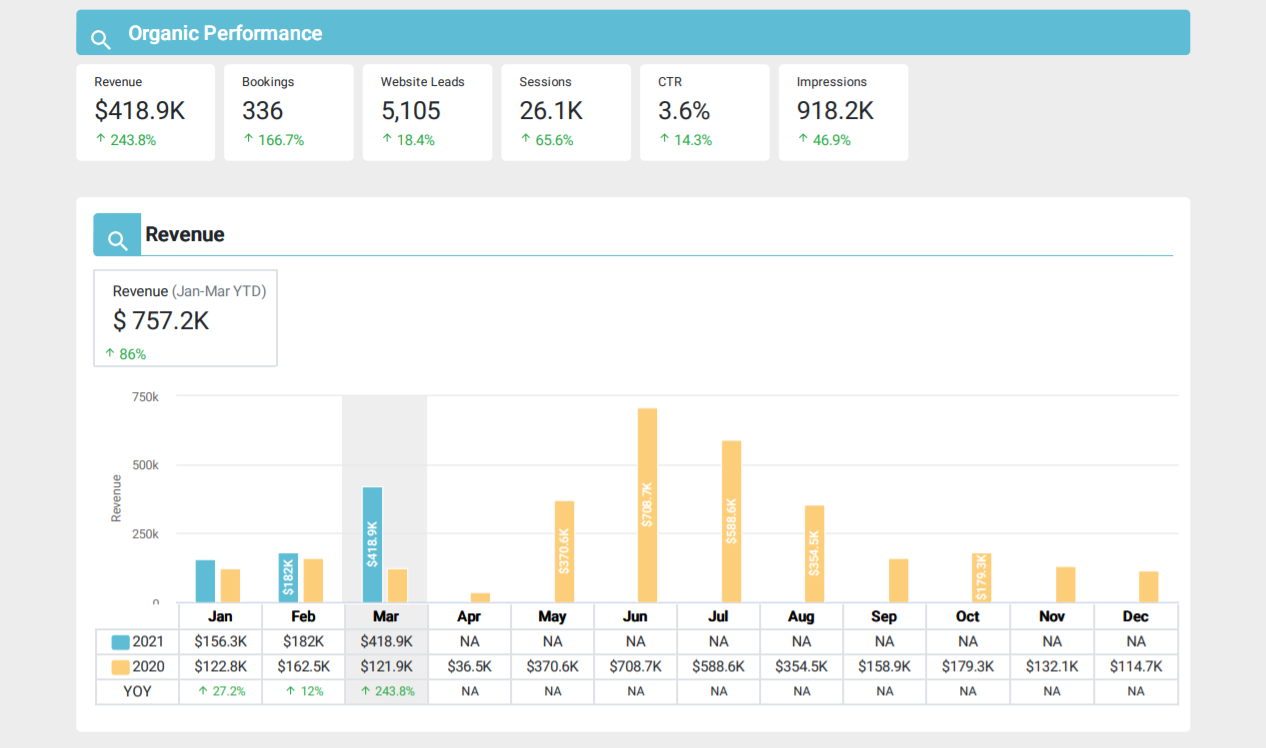
iii. Organic Performance
Displays the key metrics of the organic performance of the business location, revenue, sessions, impressions, rich results, and performance metrics of branded and non-branded keywords.
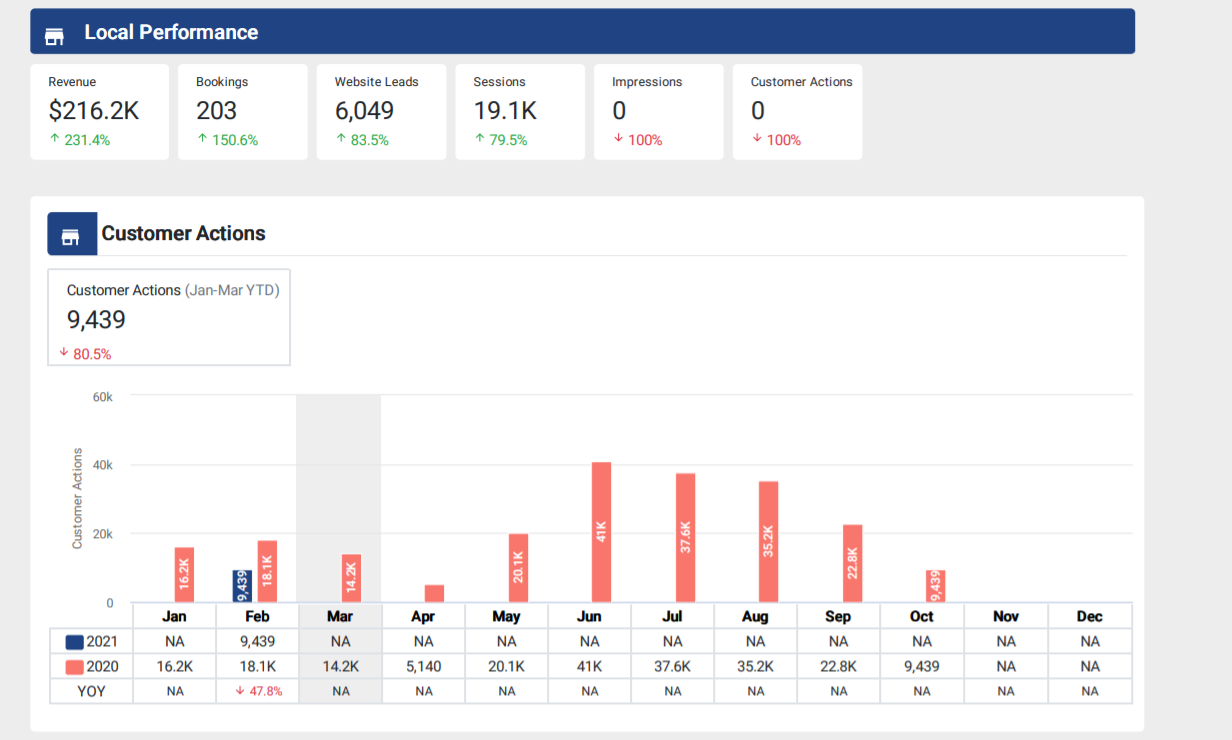
iv. Local Performance
The Local Performance section displays the key performance metrics of the local engagements and conversions of the business location. It showcases the key metrics, customer actions to reach your business location, impressions, and local performance across channels.
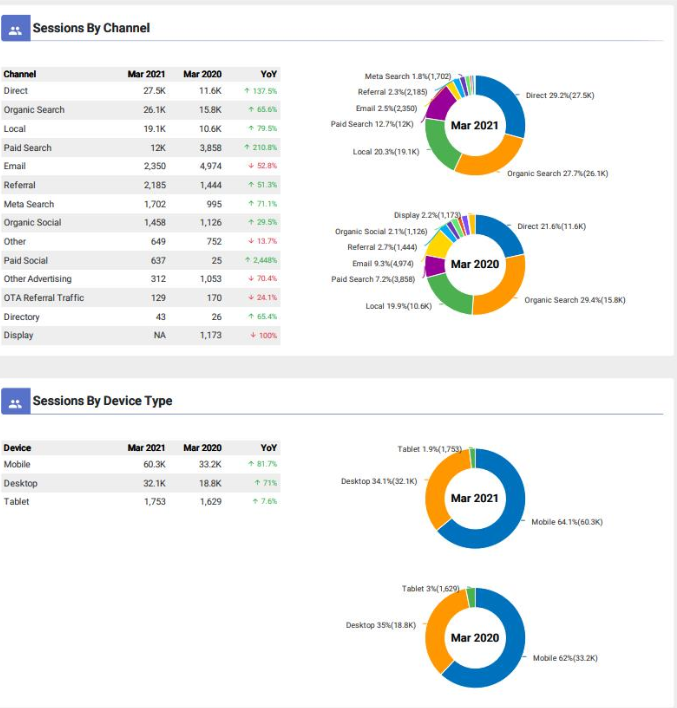
v. Audience Overview
The Audience Overview section breaks down the overall performance of the business location by channels, device type, geography and gender.
Automating the Digital Performance Report:
Follow the steps to schedule the Digital Performance Report:
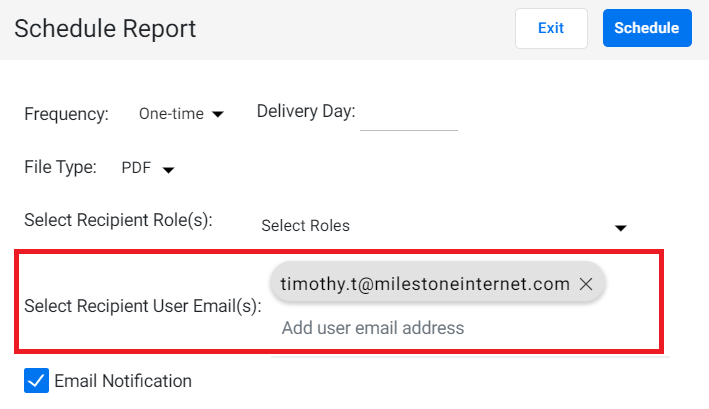
Step 1: Click on ‘Export’ and choose ‘Schedule’.

Step 2: Choose ‘One-time’ or ‘Monthly’. Choose ‘Monthly’ to schedule the report every month. Then choose the date, file type (PDF) and click on ‘Schedule’.

Note: One time and monthly report will always show data for the previous month.
Step 3: Enter your email ID to receive the one-time or monthly reports.
Download the report: Navigate to the ‘Report Summary’ tab and choose a report you wish to download in the PDF format. Click on the ‘Actions’ button to download a PDF report.

Notes:
All conversions data (revenue, website leads, hard conversions) have been taken from Google Analytics, except for Paid Media Performance section where conversions come from the paid channels. This has been done to align this section with the detailed Paid Media PDF Reports.
Revenue will be shown for clients who have GA ecommerce setup (i.e., Hospitality, non-brand clients). For all other clients, Hard conversions will be shown instead of Revenue.
Hard Conversions – are based on configuration done by CoE for the vertical or the business.
*CSMs will receive the reports via the usual process – via COEs
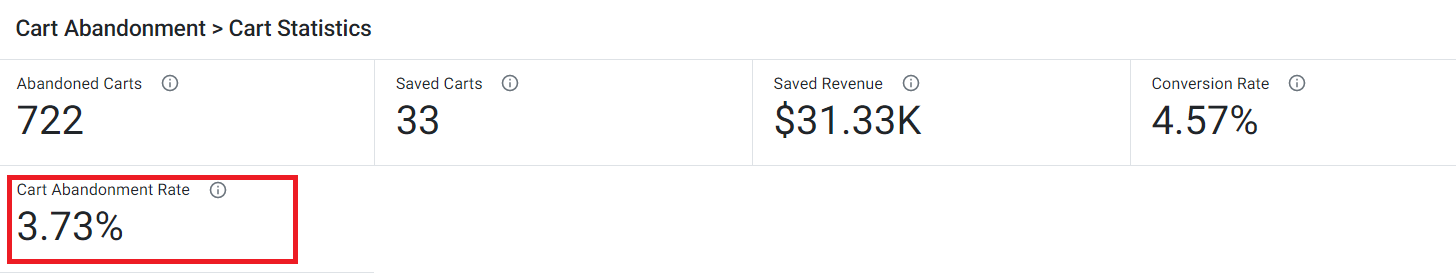
2. Cart Abandonment Percentage KPI added to Cart Abandonment widget
Opportunity: Give businesses on the percentage of customers that are abandoning their carts as part of Milestone’s Revenue Recovery Module
Solution: We’ve added the ‘Cart Abandonment’ Percentage Rate KPI to the Cart Abandonment widget
MPC > Analytics > Website Performance > Revenue Recovery > Cart Abandonment