Release: Nov 23, 2021
Analytics
Holiday Banner – New KPIs added
Opportunity: 50% of millennials look for an offer when making a purchase, 80% of customers online prefer to make a purchase when a product is on an offer and 75% of Americans abandon their carts due to lack of offers or discounts. That’s 75% of customers lost in the final stage of making a purchase, an issue that can be solved by Offers. On Milestone CMS we facilitate the use of holiday banners to drive sales during the holiday season and lure customers to make a purchase rather than choose a competitor. Of course, knowing the performance of each holiday offer is crucial to make strategic decisions in improving the revenue of the business.
Solution: With Milestone Analytics' holiday banner reporting you can now view KPIs related to your holiday season special offers to see how effective your campaigns are and analyze the traffic and revenue you are generating from advertisements from your holiday season special offers.
Path: MPC Dashboard > Analytics > Website Performance > Holiday Banner
Step 1: In the ‘Analytics’ section, click on ‘Website Performance’ in the left navigation panel
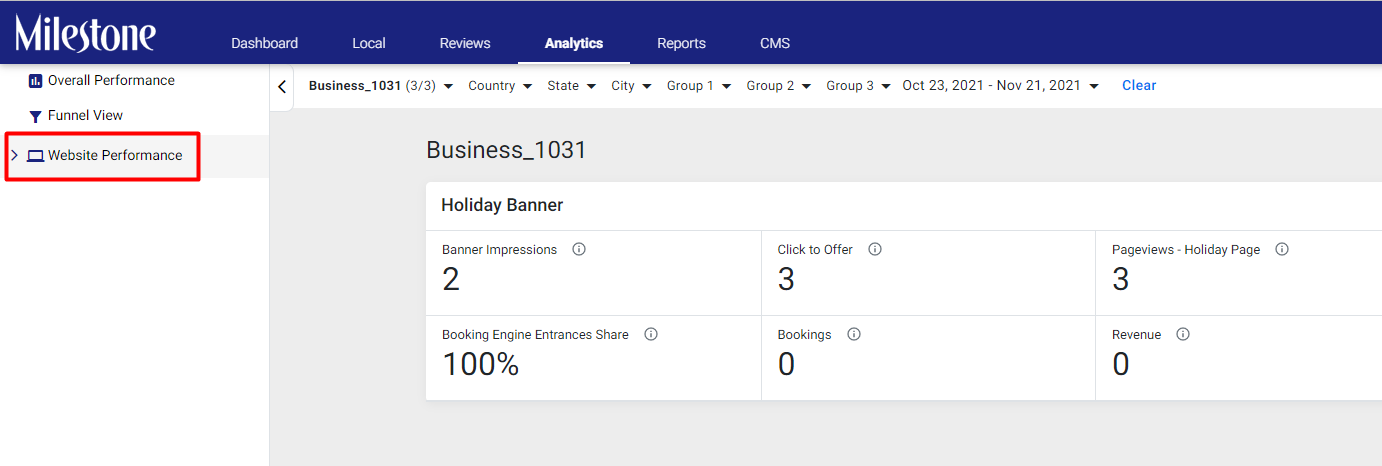
Step 2: Click on ‘Holiday Banner’ from the dropdown
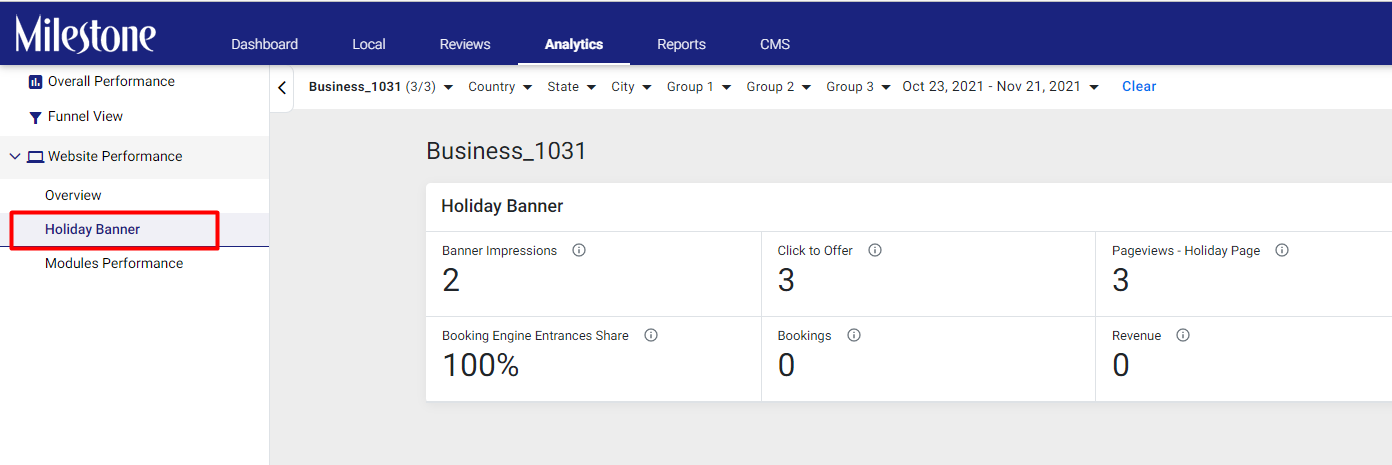
In the ‘Holiday Banner’ section you will be able to view KPIs related to the Holiday Banner like:
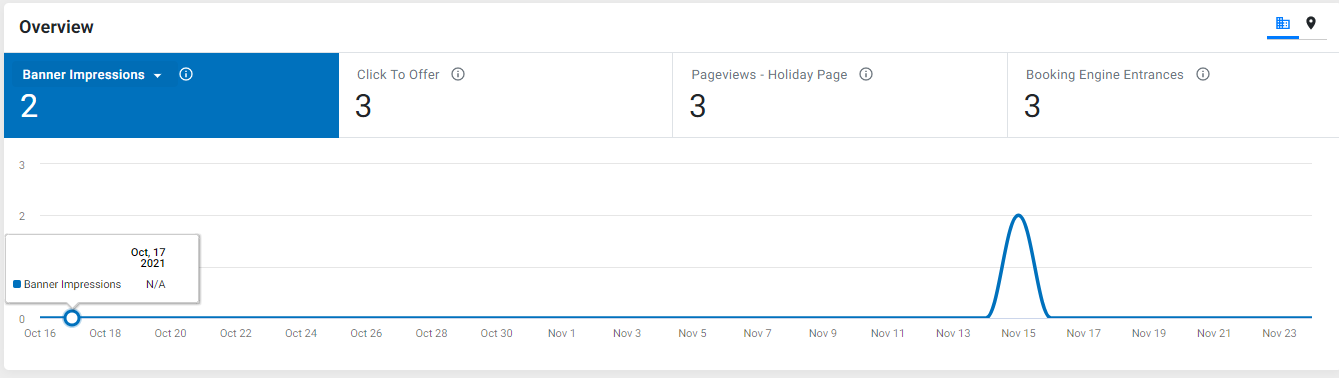
Banner Impressions: The total number of times the Holiday Banner has appeared in searches.
Clicks on Offer: The number of times users click on your Holiday Banner ad.
Pageviews – Holiday Page: The number of times users navigated and viewed the Holiday Page via the Holiday Banner.
Booking Engine Entrances: If a booking engine is attached to the Holiday Banner, the number of times users entered the booking engine via the Holiday Banner.
Booking Engine Entrances Share: The percentage of users entering the booking engine via the Holiday Banner.
Bookings: The number of bookings received from the Holiday Banner.
Revenue: The revenue generated through the Holiday Banner.
Local
Facebook Insights
Opportunity: Facebook is the leading social platform, reaching 59.0 percent of social media users with over 2.59 billion monthly active users. Over 200 small and medium businesses use Facebook to reach their audiences and 63% of the US population u use Facebook to reach friends, families, and businesses. This means that Facebook is indeed a platform that brands can use to reach out to their audiences. To know how to better your reach and create a perfect organic + paid ratio to improve visibility, we’ve introduced Facebook Insights on Milestone Local.
Solution: The new ‘Facebook Insights’ section will help you monitor the effectiveness of your Facebook page in terms of views and customer actions by showing you the performance of your Facebook page and can help you make better informed decisions on Facebook.
Path: MPC Dashboard > Local > Facebook Insights
Step 1: In the ‘Local’ section go to ‘Facebook Insights’ in the left navigation panel
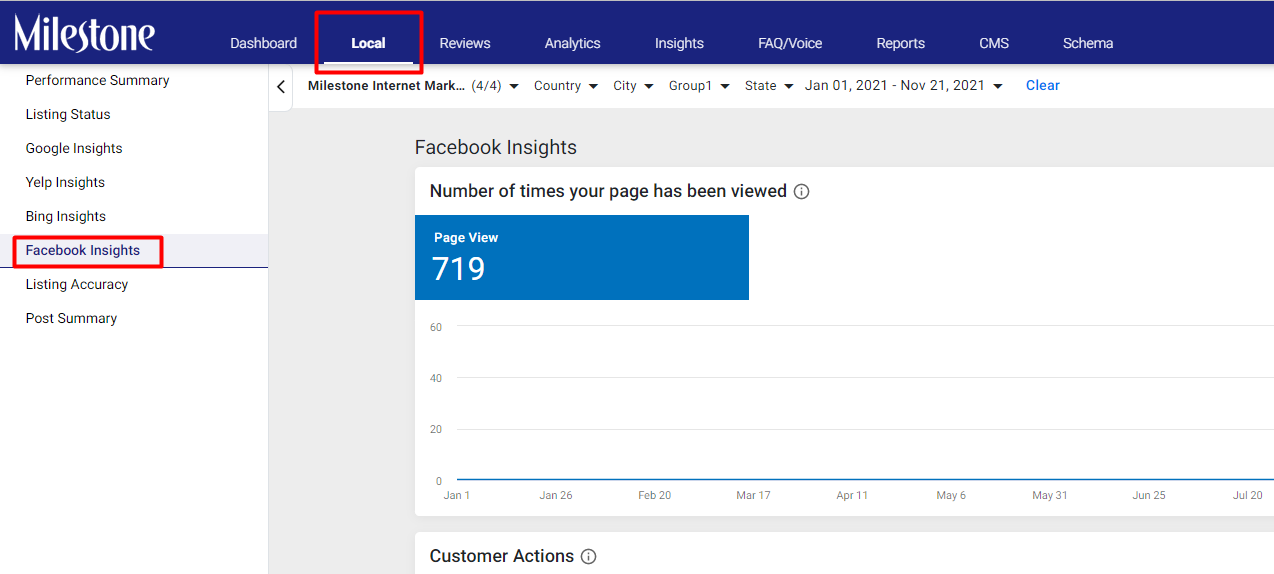
The ‘Facebook Insights’ visualizations will provide you insights on how users are interacting with your business through Facebook.
Number of times your page has been viewed
These insights will provide you with an overview of the traffic coming to your Facebook page.
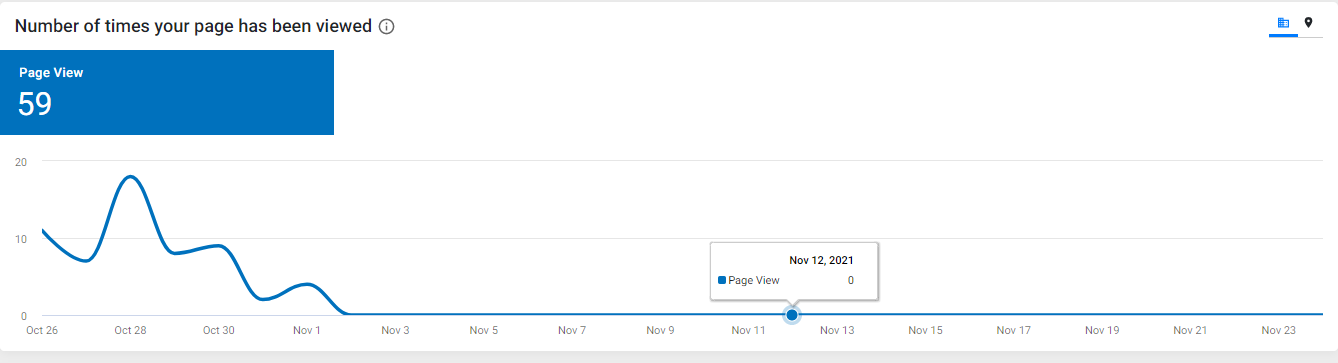
Page View: The number of times your Facebook page has been viewed.
Customer Actions
Customer Actions shows you the actions that Facebook users take on your Facebook page. These actions usually suggest an elevated level of interest in your business.
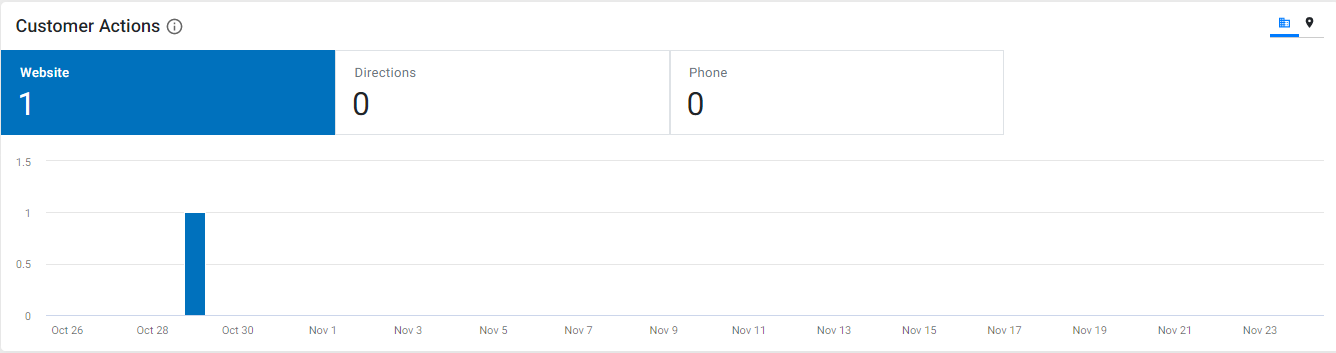
Website: The number of Facebook users that visited your website.
Directions: The number of Facebook users that took driving directions to your place of business from your Facebook page.
Phone: The number of users that used the ‘Call Now’ button to make a phone call to your business.
How customers interact with your business on Facebook
This section shows you how customers use features on Facebook to interact with your business.
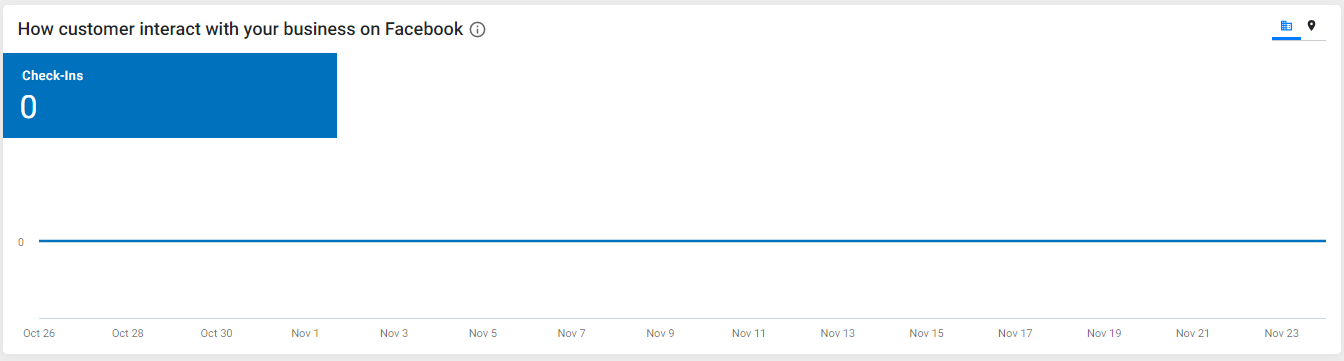
Check-ins: The number of customers that check-in to your business on Facebook.
Fans
This provides you with an overview of Facebook users that actively engage with your Facebook page.
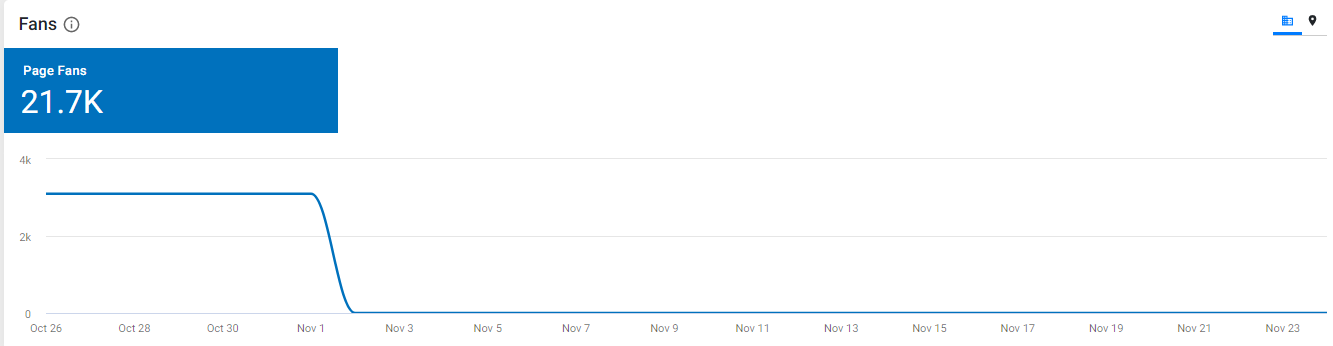
Page Fans: The number of Facebook users that are fans of your page and receive notifications of activities on your page.
Insights
Competitive Summary
Opportunity: To align with Google’s ranking factors and ensure your website is meeting all the SEO parameters to improve its visibility and engagement on SERPs, constant monitoring is required. This is done using Milestone Insights. Businesses can deep dive into the key requirements and parameters to ensure that every SEO aspect is taken care of and there are no deterrents towards the ranking of the website on search. Of course, for a business to know what its website lacks and key opportunities it needs to take to stay ahead of its competition, a competitive summary is the need of the hour.
Solution: With the new Competitive Summary section you can deep dive into the key SEO parameters of your website against your competition and know where you edge out your competition and where you need to catch up to give you a holistic picture of what your website needs to take care of to be visible on search.
Insights > Competitive Summary
From the ‘Insights’ section go to ‘Competitive Summary’ in the left navigation panel
Here users can view information related to crawling and indexing, page experience, schemas and clickability, content and relevancy, local and authority.
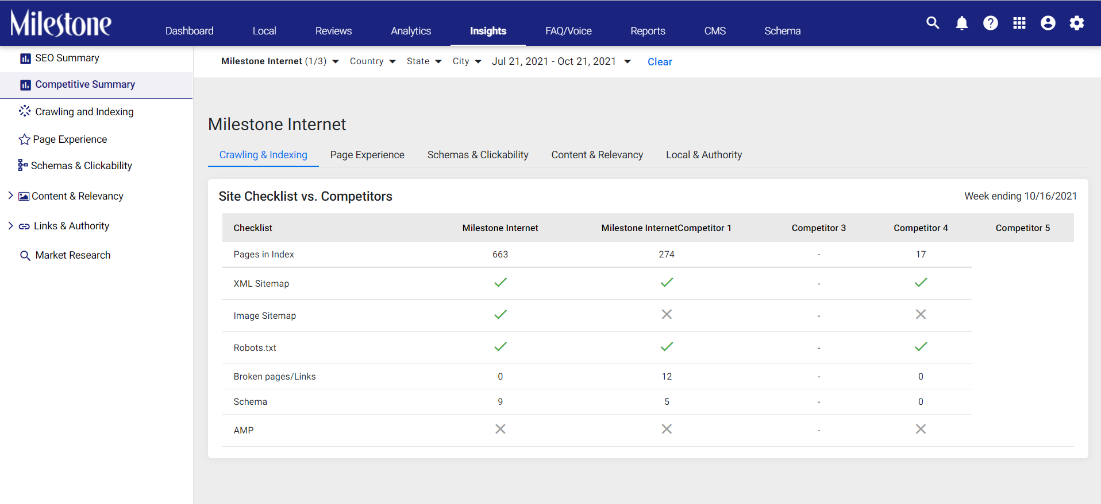
Crawling and Indexing
Site Checklist vs Competitors screen shows you crucial website information and data related to the overall indexability of the web pages.
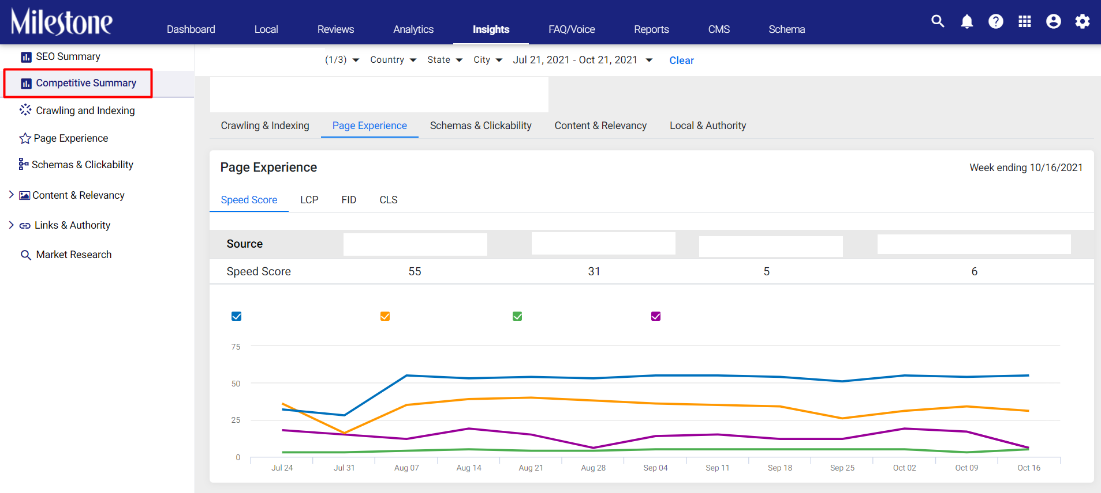
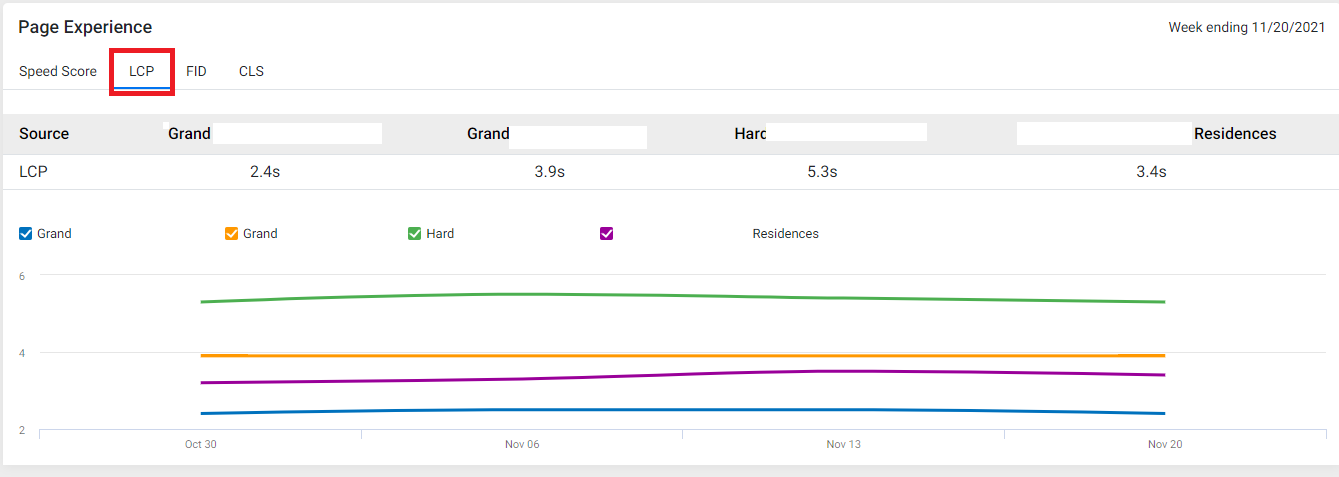
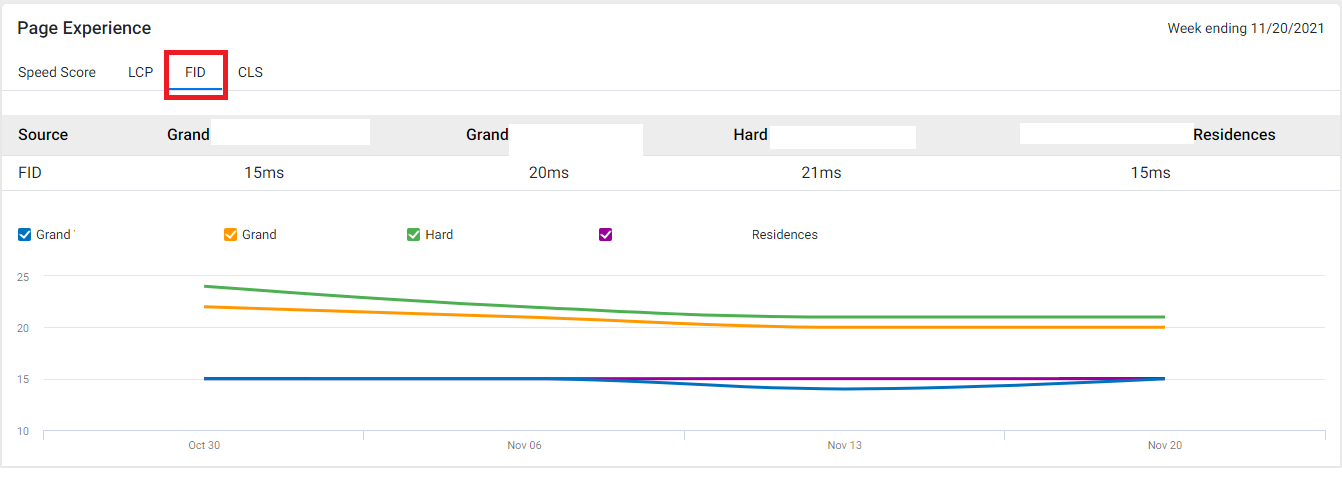
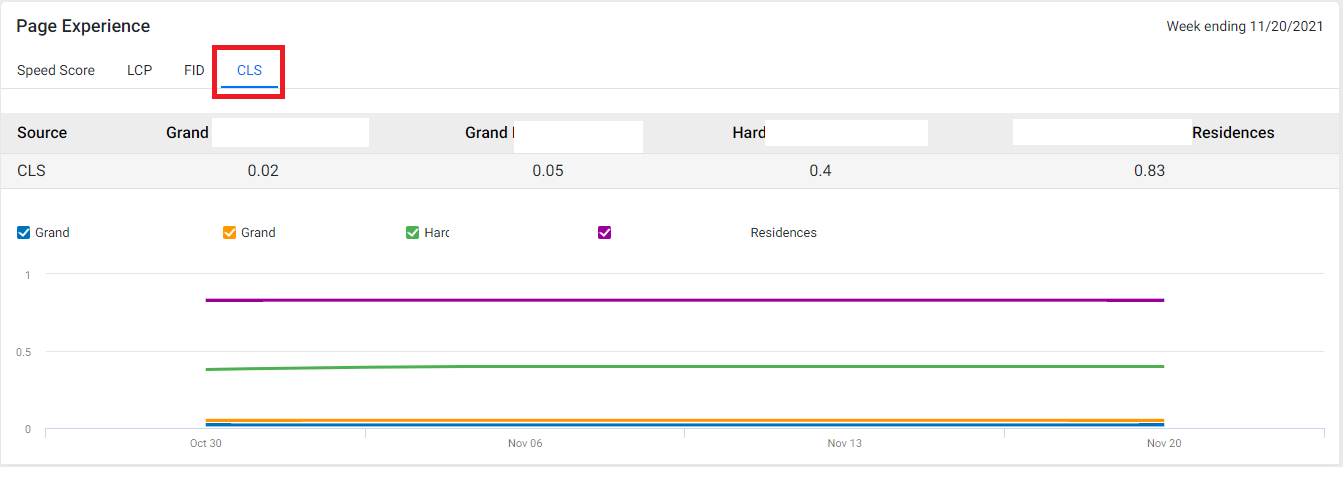
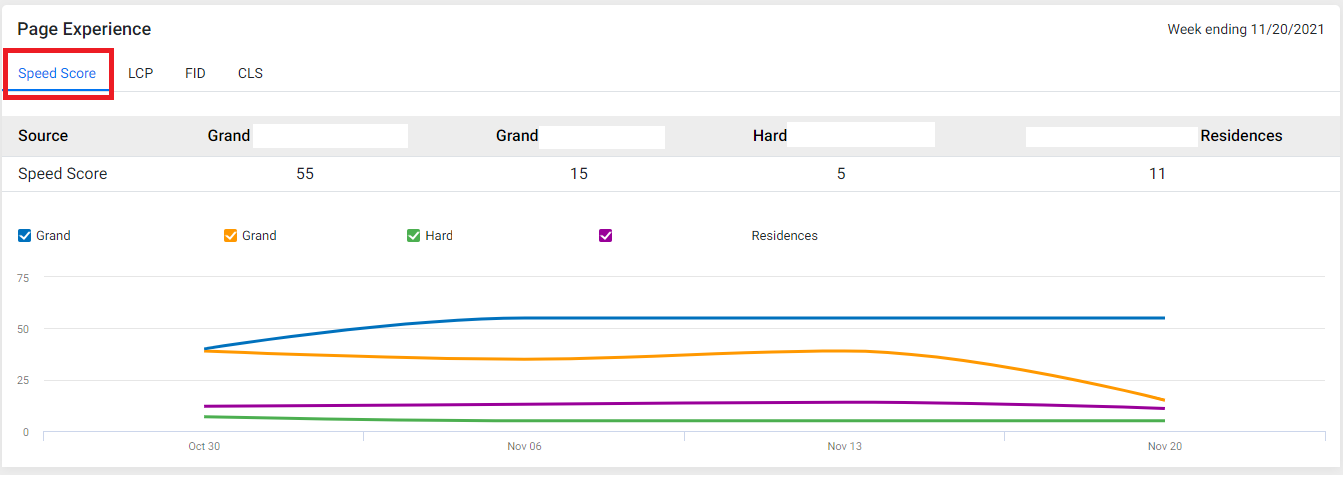
Page Experience
Page Experience section shows you a competitive analysis of Google’s KPIs for Page Experience. Users can include or exclude competitors from the graph view by clicking on the corresponding check boxes.
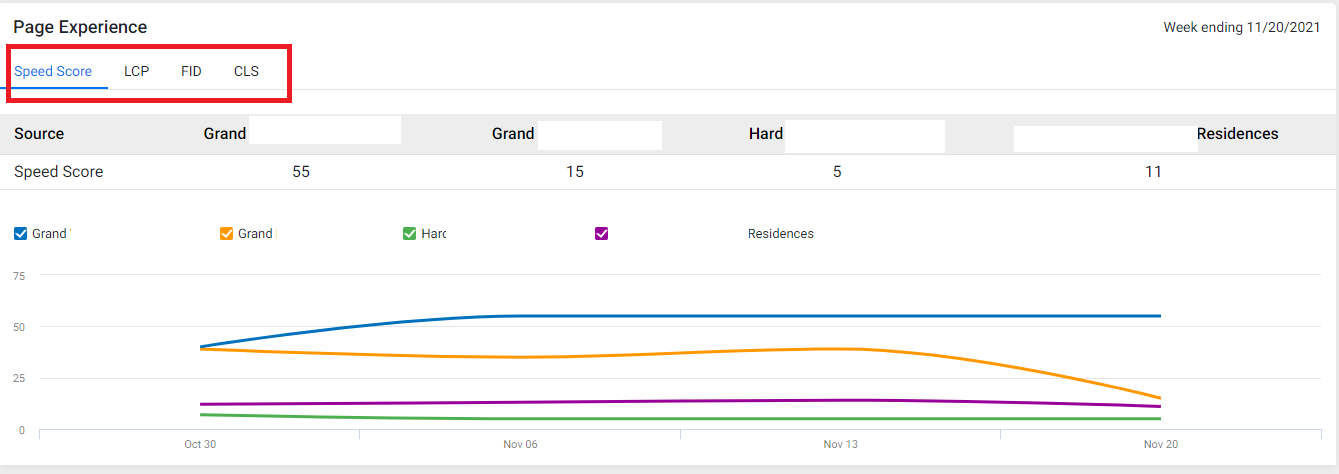
LCP (Largest Contentful Paint): This measures how long it takes for the largest piece of content to load on your page.
FID (First Input Delay): This measures the time it takes for the website to react to a user’s first input.
CLS (Cumlative Layout Shift): This measures the visual stability of your website. It denotes shift in the content of pages while it is loading.
Speed Score: This is the cumulative score of your website considering LCP, FID and CLS.
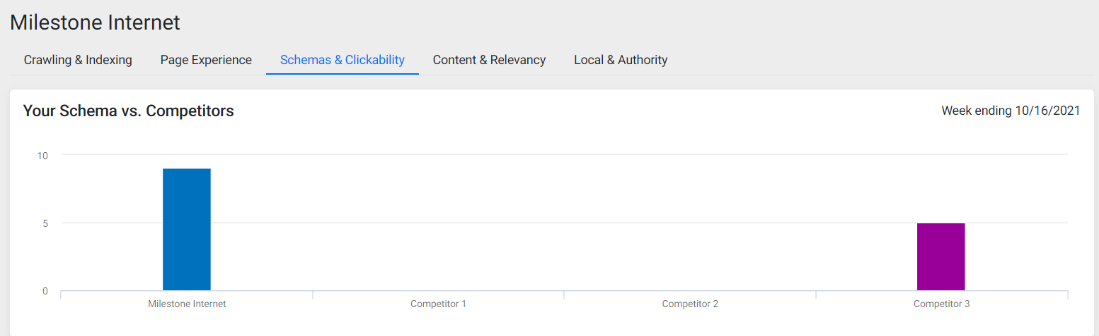
Schemas and Clickability
Schemas and Clickability shows a comparative view of the number of pages with schemas deployed.
Content & Relevancy
Visibility Footprint shows users a comparative view of how well their website performs at organically generating traffic versus their competitors’. The three KPIs used for this are Organic Keywords, Organic Traffic and Potential Cost Savings.
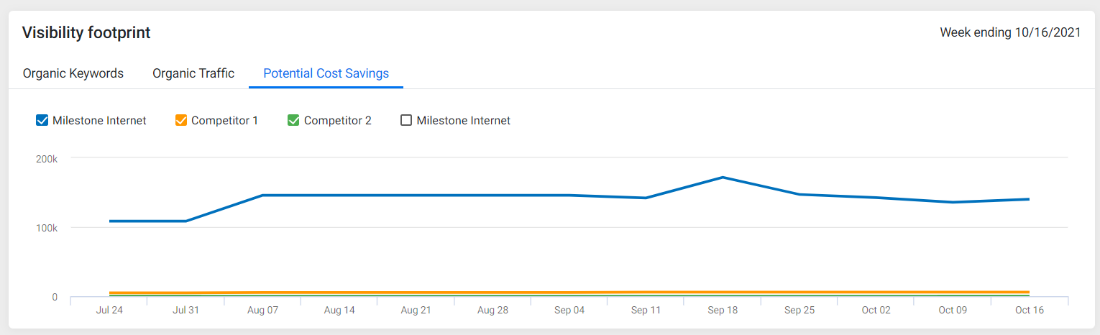
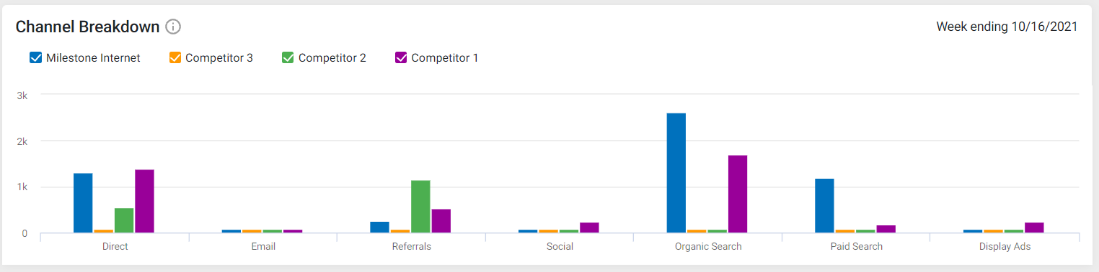
A channel-wise breakdown shows users a comparative view of how their website is being discovered versus their competitors’ websites.
Local & Authority
Follow vs No Follow
The Follow vs No Follow chart shows a comparative view of the total number of links that direct back to your website versus your competitors.
In the ‘Insights’ section go to ‘Competitive Summary’ in the left navigation panel
Click on ‘Local & Authority’
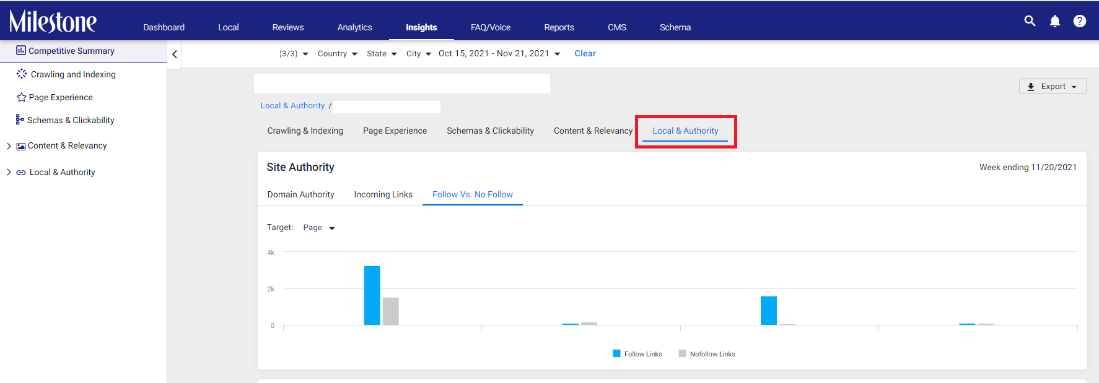
Select ‘Follow vs No Follow’
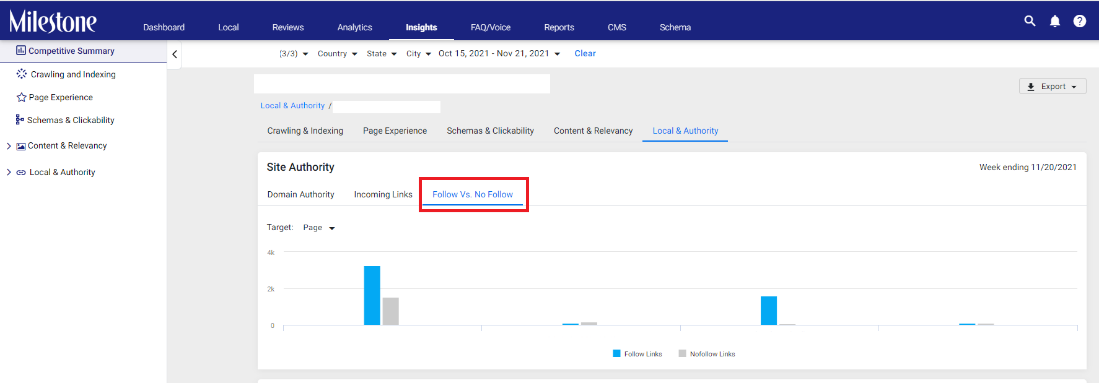
The blue bar represents ‘Follow’ links and the grey bar represents ‘No Follow’ links.
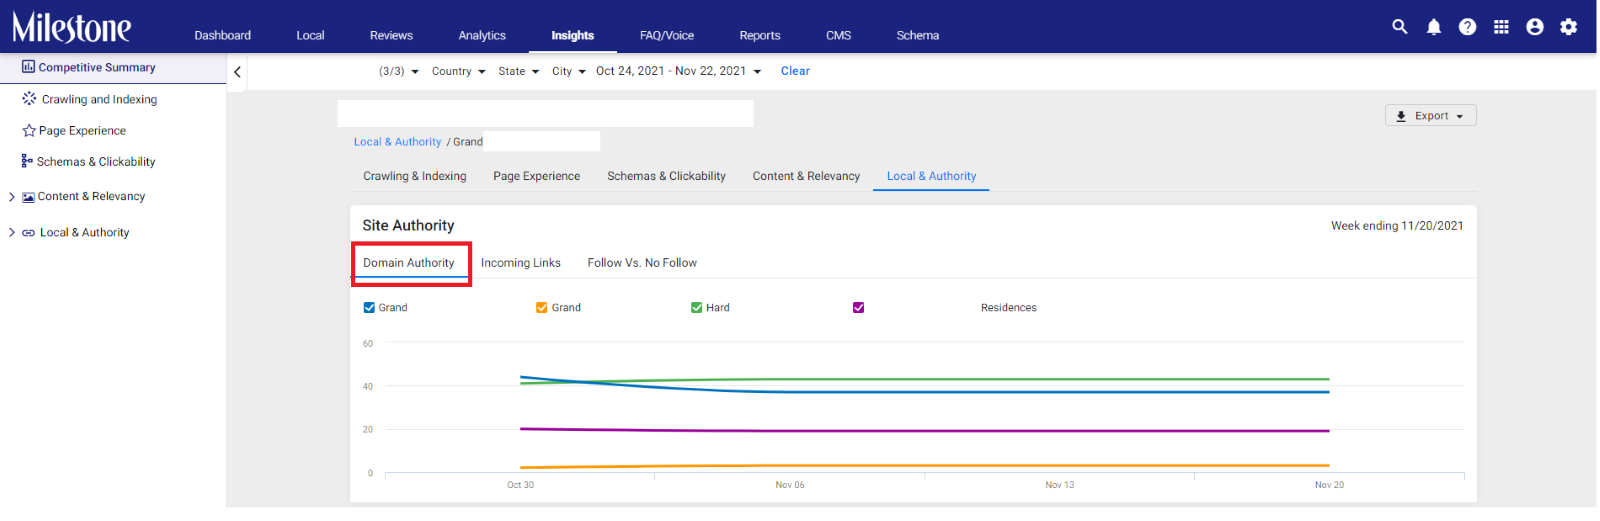
Domain Authority
The Domain Authority graph shows a comparative view of how relevant your website is for searches in comparison to your competitors.
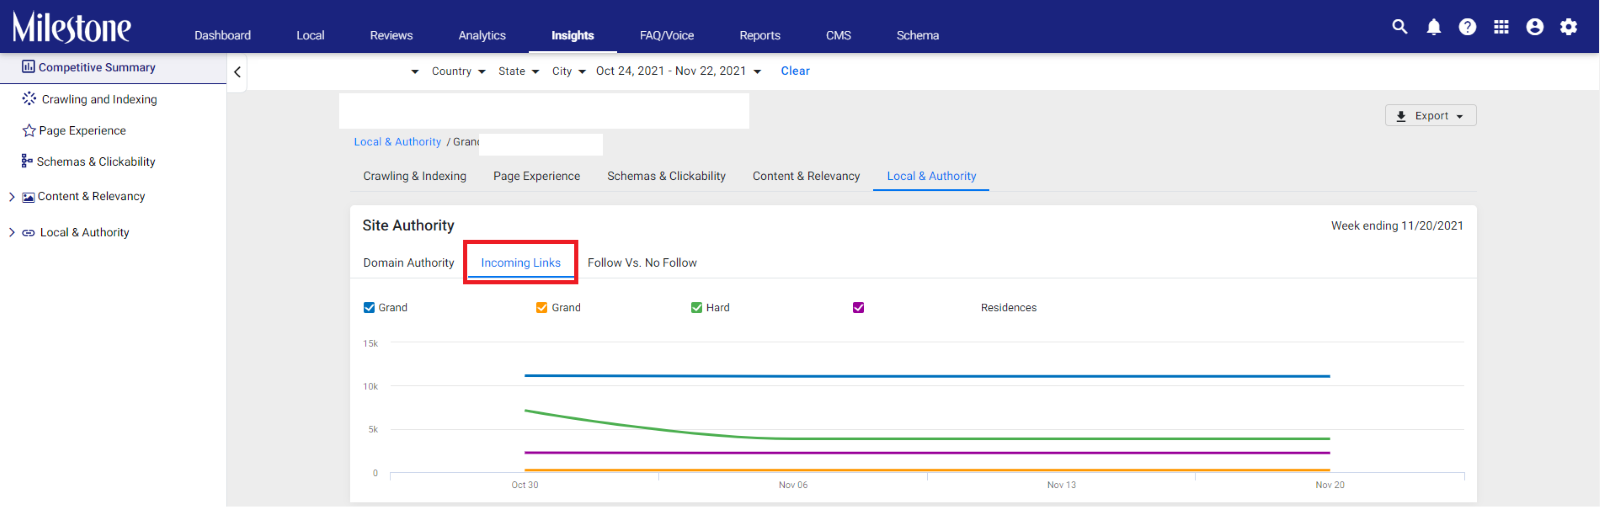
Incoming Links
The Incoming Links section shows you how many links you are receiving from third parties in comparison to your competitors.
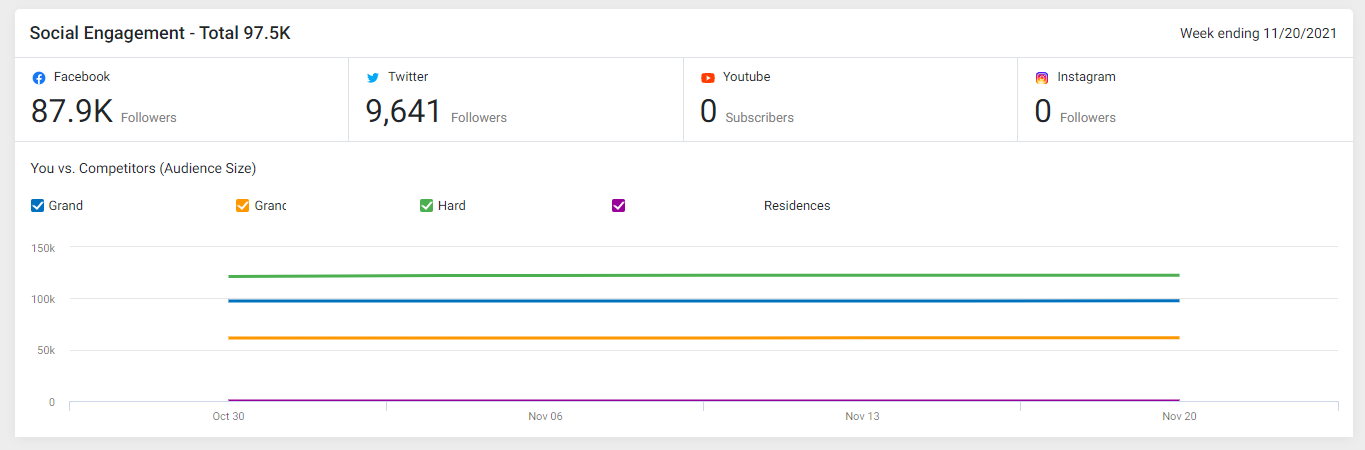
Social Engagement
The Social Engagement section shows you a comparative view of engagement on social media channels like Twitter, Facebook, YouTube, etc.