Performance Summary Dashboard & Functions
Overview
The Schema Performance Summary gives agencies a centralized view of how structured data (schema) is performing across client websites. Designed for multi-client and multi-site management, it helps agencies quickly analyze impressions, clicks, search appearance types, and cost savings from schema implementation. This view allows for both macro-level insight across accounts and micro-level detail by URL or schema type—ideal for optimizing SEO performance and demonstrating ROI to clients.
Background & Workflow
This feature helps agencies:
- Monitor schema performance across multiple client properties.
- Identify which schema types or combinations yield the best results.
- Compare structured data-driven performance metrics beyond what Google Search Console (GSC) offers.
Step-by-Step Flow
Accessing Performance Summary
Path: Dashboard > Schema > Performance Summary

Start by selecting the desired date range to filter your dataset.
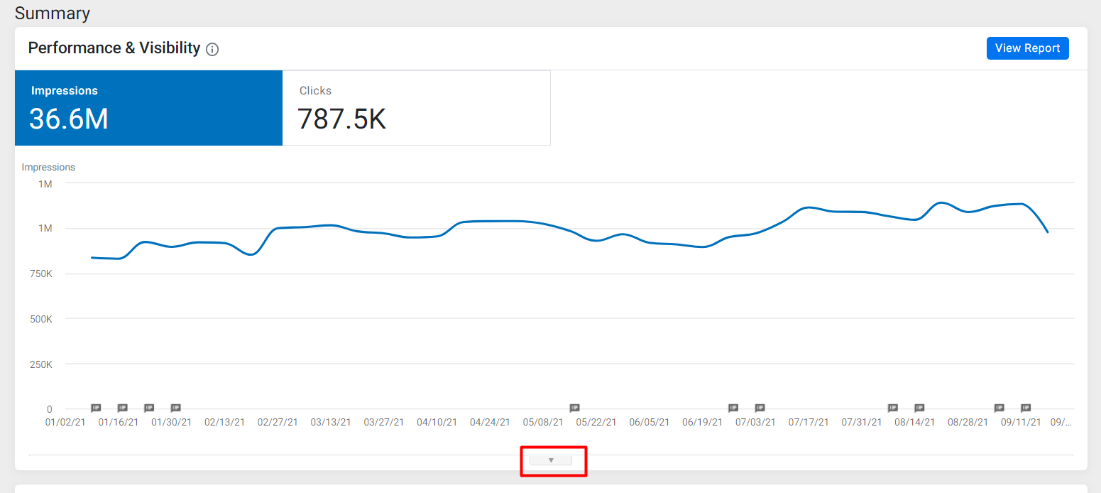
Performance Data Tiles
At the top, you'll see four key performance indicators (KPIs):
- Total Impressions: Number of times pages appeared in search results.
- Total Clicks: Clicks on structured data-enabled results.
- Potential Cost Savings: Estimated ad spend savings from schema usage.
- Total Universal Results: Volume of rich results (videos, images, etc.).

Performance Views
Choose one of the four tabs to explore specific performance data:
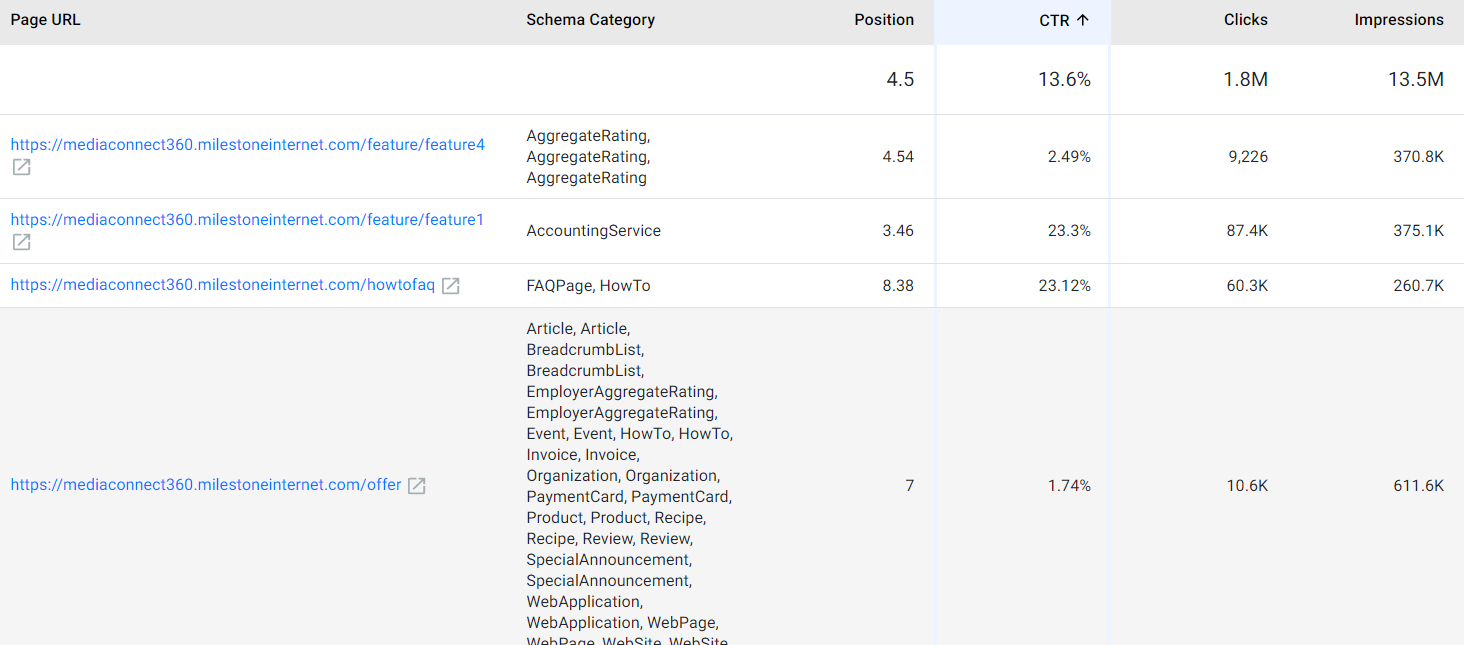
- All Results: Overall search metrics (Impressions, Clicks, CTR, Avg. Position) per URL. Useful for a high-level summary.

You will also see the breakdown of search performance for each URL that has a published schema.
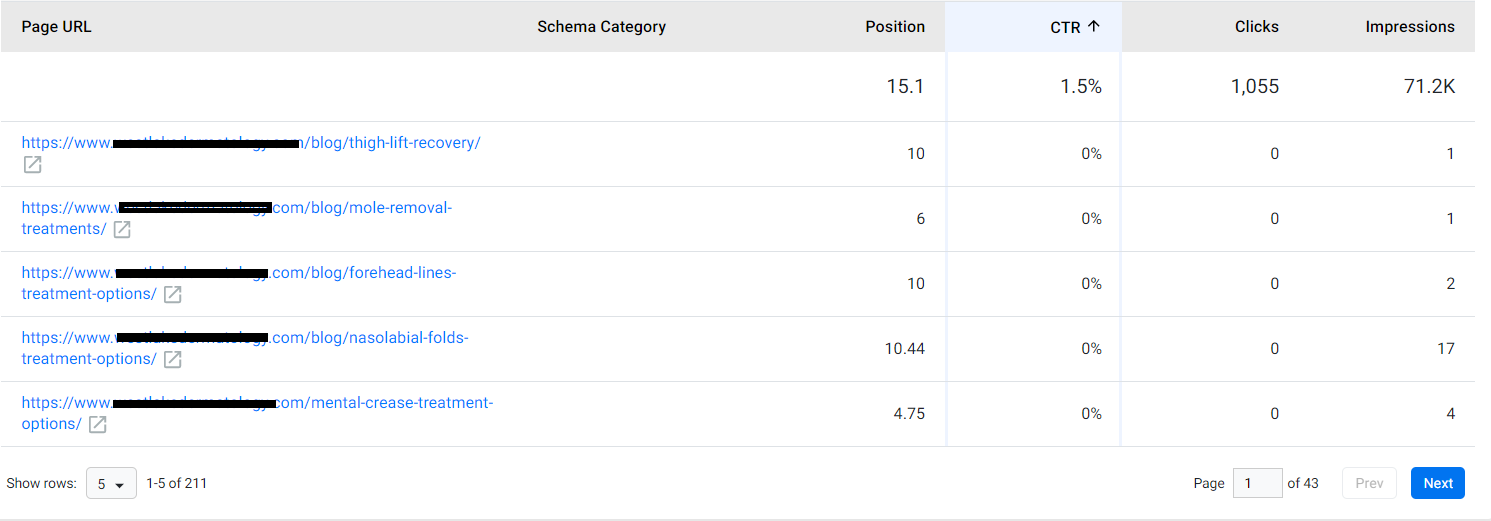
- Rich Results: Shows how rich snippets (e.g., FAQs, reviews) perform. Ideal for identifying impactful schema types.

Here too, the page will display the rich result performance for each URL with published schema.
- Categories: See performance by schema type or combination. Use this to fine-tune schema strategy.

- Potential Cost Savings: View estimated ROI by schema deployment. Compare dollar value saved with CTR and impressions.

For the date period selected, you will also see the total universal search results (basically how and where your web content appeared on search). You will also see the data for each universal search independently. Click on any of the universal search results to view its performance on the trend graph.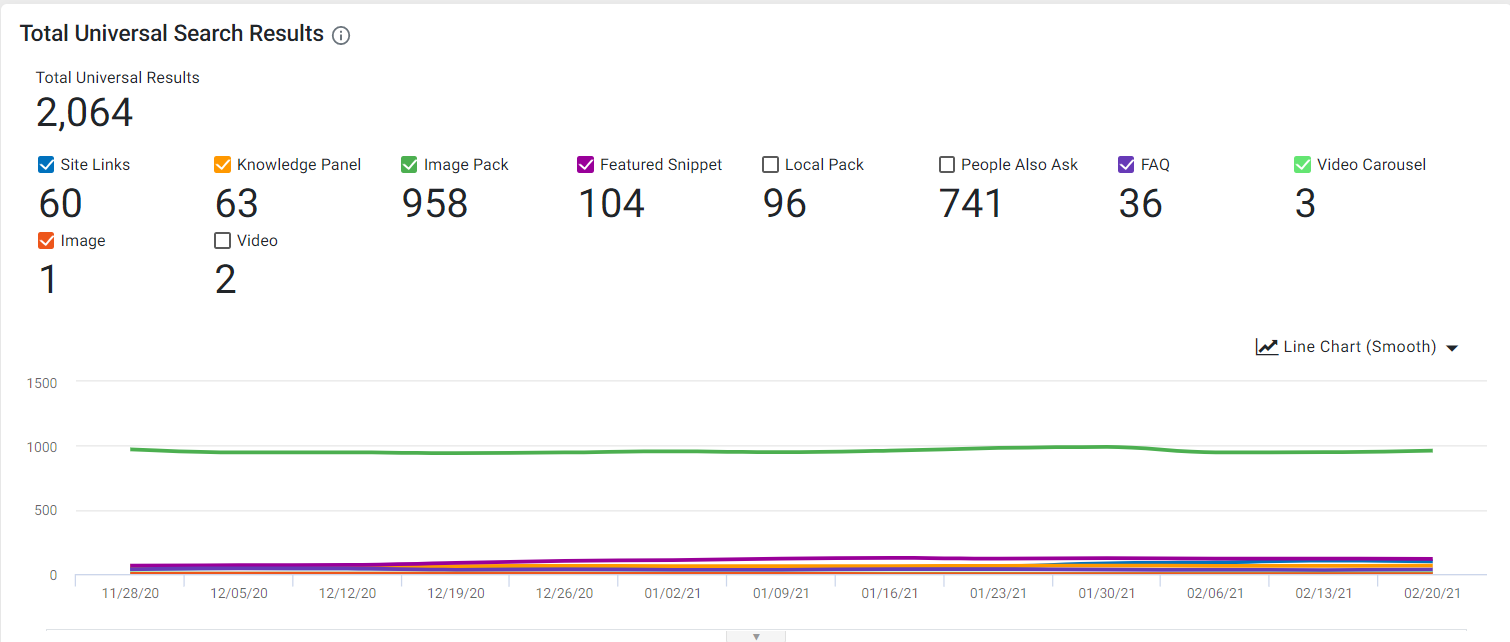
Filters: The filter dropdown will drill into performance by page, event, or other dimensions. Note: Page-level filters may inflate impression/click numbers due to how URLs are grouped.
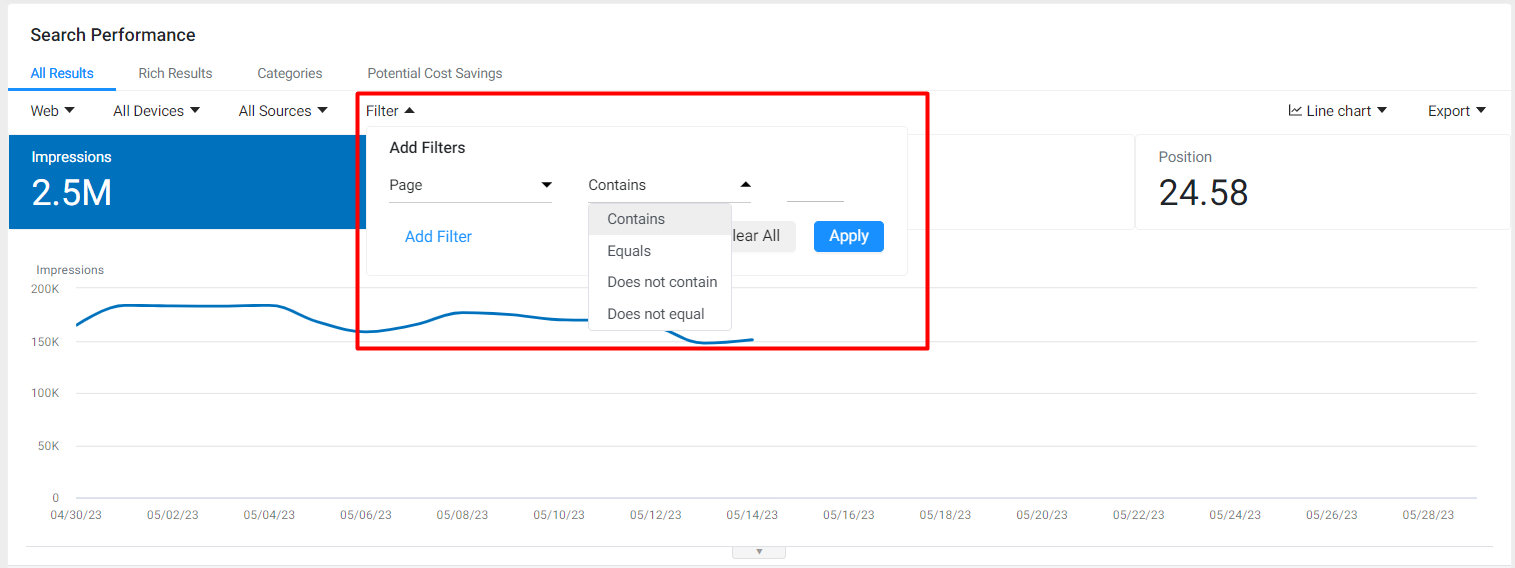
You can add multiple filters to the widget by clicking on 'Add Filter' in the filter dropdown menu.

Annotation Feature
Path: Schema > Peformance Summary
Steps:
Click the dropdown below the charts.
Select "Create New Annotation."
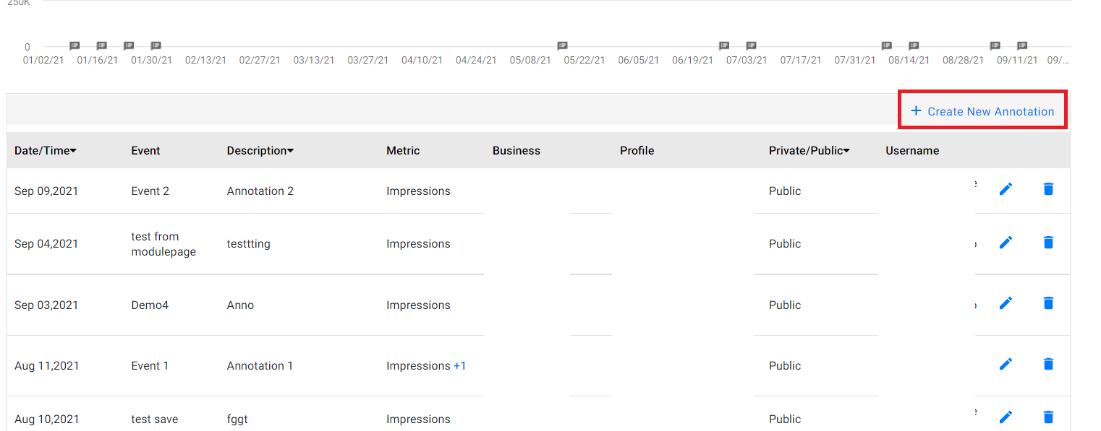
Add an Event via the dropdown > "Add Event."

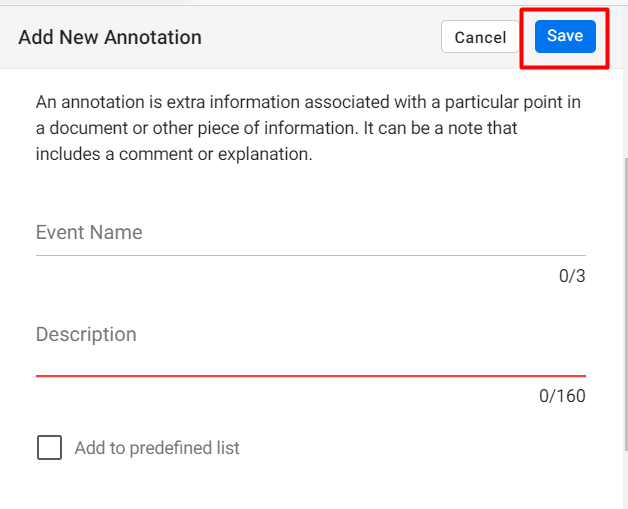
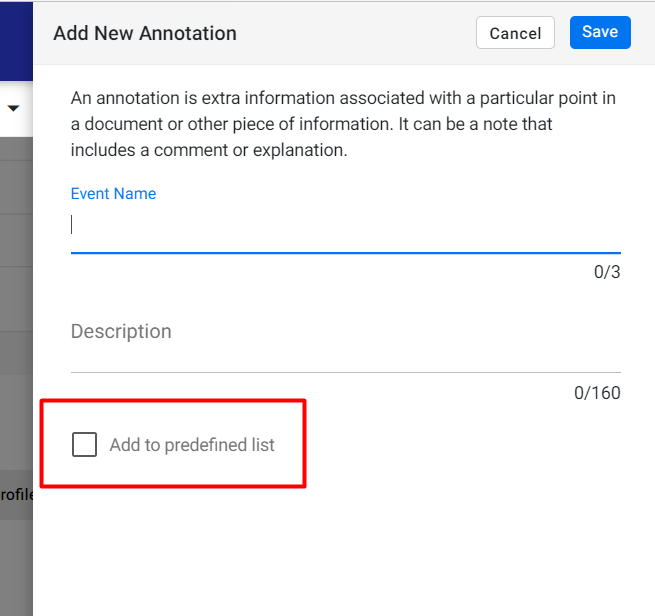
Input Event Name and Description. Optionally, check "Add to Predefined List" to reuse it.

Click "Save." This annotation now appears on the widget timeline.
You can use the ‘Add to predefined list’ feature to save an annotation for reuse later. This is useful for regularly occurring events
Exporting Data
Use the "Export to Excel" feature to extract schema performance reports for sharing with clients or internal stakeholders.

Schema vs. Google Search Console
| Comparison Metric | Google Search Console | Schema Performance Summary |
|---|---|---|
| Export Limits | 1,000 rows | Full dataset export |
| Data Retention | 16 months | All available data post-setup |
| Schema Filtering | Not available | Filter performance by schema type |
| Search Appearance | Individual views only | Unified and individual views |
| URL-Query Mapping | Separated | Easy URL to query matching |
| Schema Mapping | Not available | View schema combos per URL |
| ROI Visibility | Not available | Potential Cost Savings view |
Glossary of Terms
- Schema (Structured Data): Code added to web pages to help search engines understand content.
- Rich Results: Enhanced search results with visuals or interactive elements.
- Universal Results: Search results beyond the standard blue link (e.g., images, local packs).
- Potential Cost Savings: The estimated marketing value derived from schema-driven visibility.
- Annotations: Notes added to widgets to highlight events or changes impacting performance.
Tips for Agency Success
Audience Guidance
This feature is ideal for:
- SEO Leads and Analysts monitoring structured data performance.
- Account Managers preparing client reports.
- Content Strategists identifying which schema types to prioritize.
Use during:
- Client onboarding (to benchmark performance).
- Monthly/quarterly reporting.
- Schema audit or performance reviews.