Descripción general del resumen de rendimiento
La pestaña Rendimiento del esquema le brindará a su empresa información clave sobre el rendimiento de sus páginas web, resultados enriquecidos y categorías de esquema para el intervalo de fechas seleccionado.
Haga clic en ' Esquema' en MPC > Resumen de rendimiento
En la pantalla Rendimiento de búsqueda, puede seleccionar entre ver el rendimiento de su página web para 'Todos los resultados', 'Resultados enriquecidos', 'Categorías' y 'Ahorros de costos potenciales'.
1. Todos los resultados
En la pantalla 'Todos los resultados', verá el rendimiento de búsqueda de sus páginas web en términos de 'Impresiones totales', 'Clics totales', 'CTR promedio' y 'Posición promedio' para el intervalo de fechas seleccionado. Haga clic en el mosaico del cuadro de mando de cualquiera de los KPI para ver su rendimiento en el gráfico de tendencia.
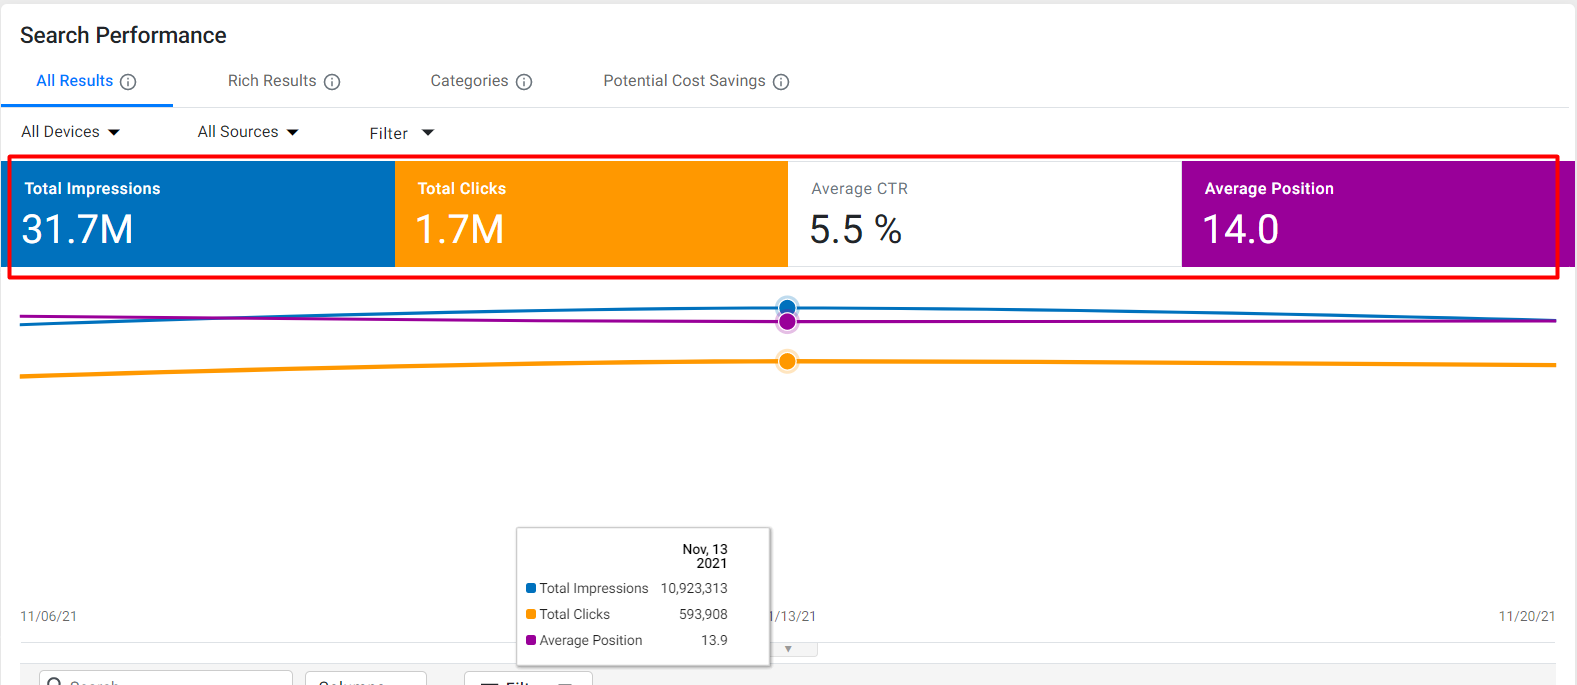
También verá el desglose del rendimiento de búsqueda para cada URL que tenga un esquema publicado.
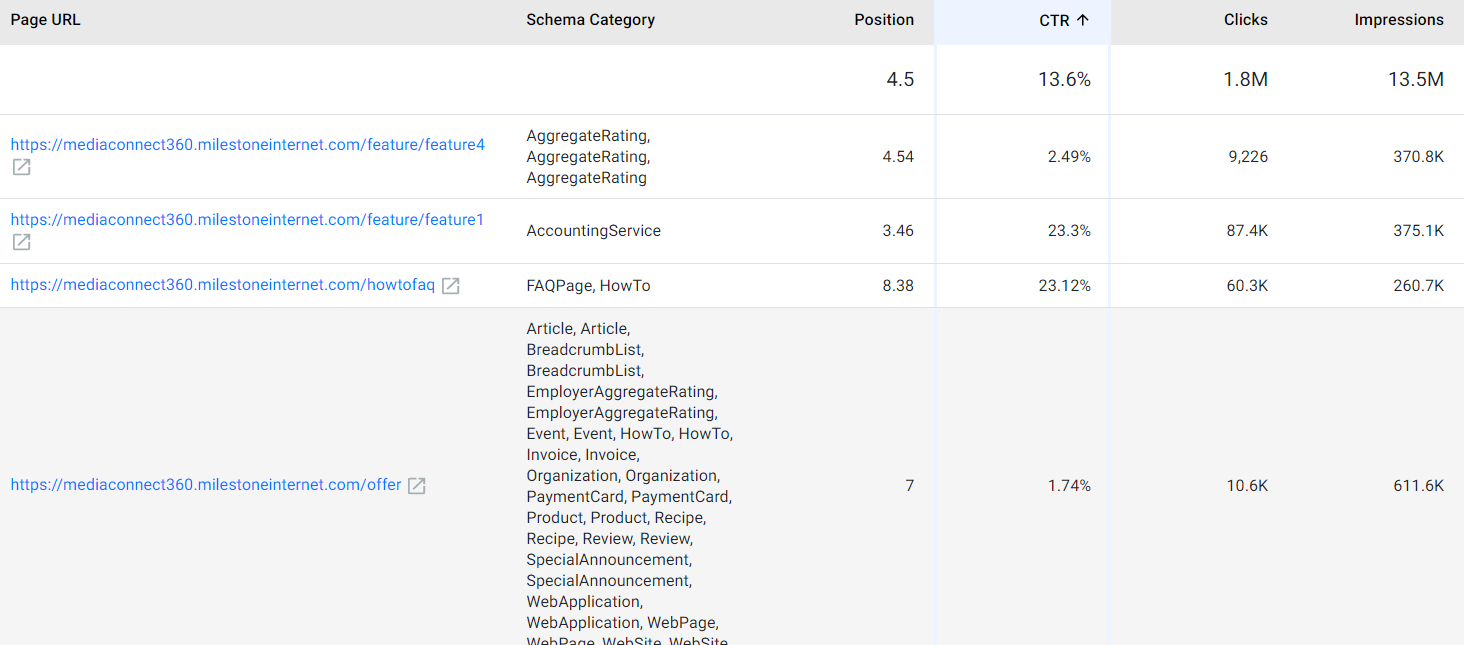
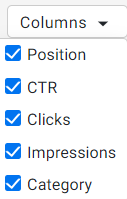
Usando el filtro 'Columnas' puede elegir los KPI que desea ver.
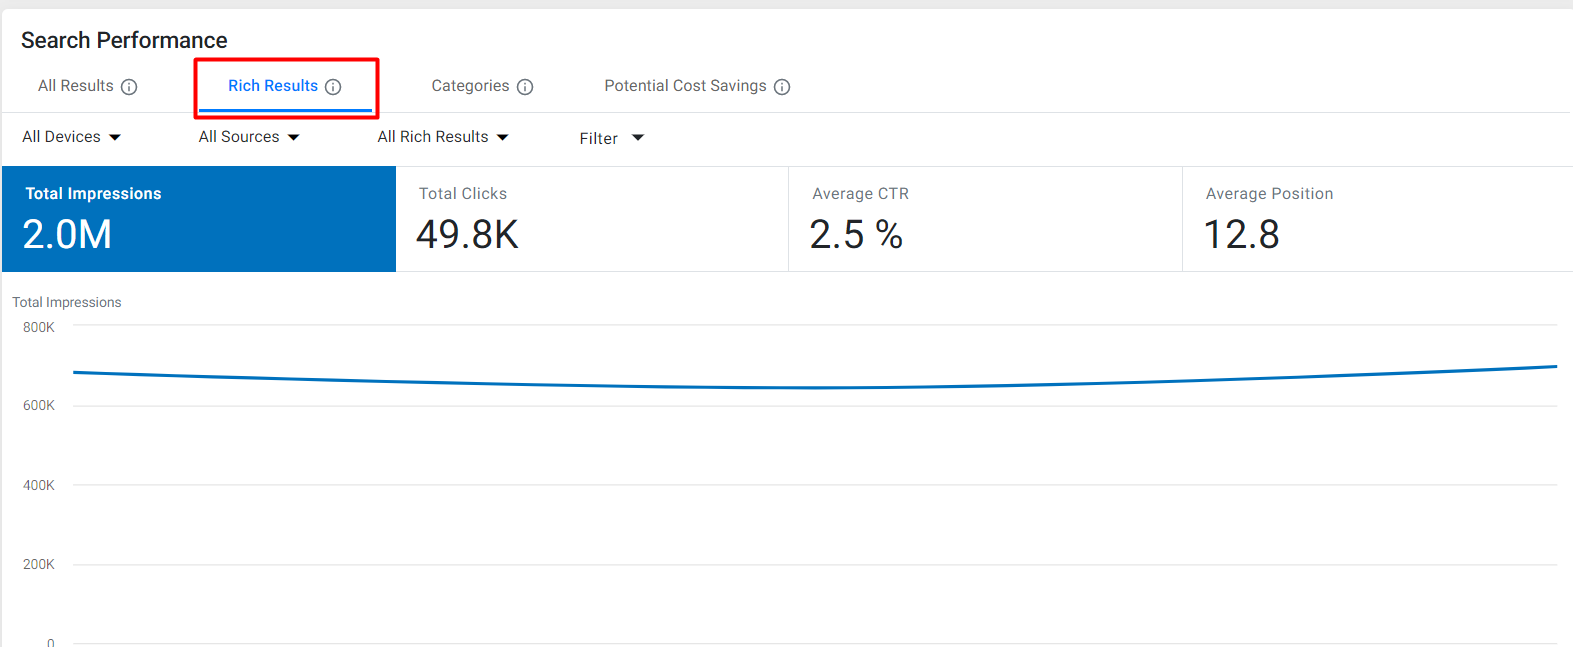
2. Resultados enriquecidos
Al elegir "Resultados enriquecidos", verá el rendimiento de búsqueda de sus resultados enriquecidos en términos de impresiones totales, clics, CTR promedio y Posición promedio en la búsqueda. Haga clic en el mosaico del cuadro de mando de cualquiera de los KPI para ver su rendimiento en el gráfico de tendencia.
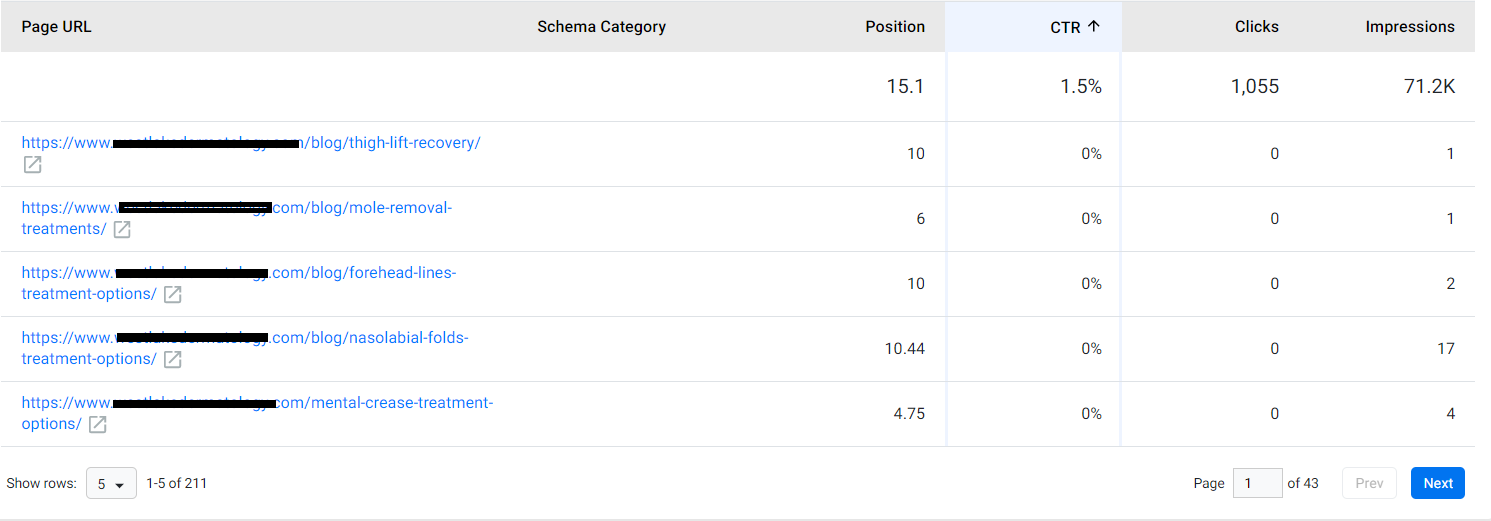
Aquí también, la página mostrará el rendimiento de los resultados enriquecidos para cada URL con esquema publicado.
3. Categorías
Esto muestra el rendimiento de las categorías o combinaciones del esquema. Con estos datos, sabrá exactamente qué combinaciones de esquemas funcionan para sus páginas web y cuáles no. Verá KPI clave como Posición en la búsqueda, CTR, Clics de URL e Impresiones de URL.
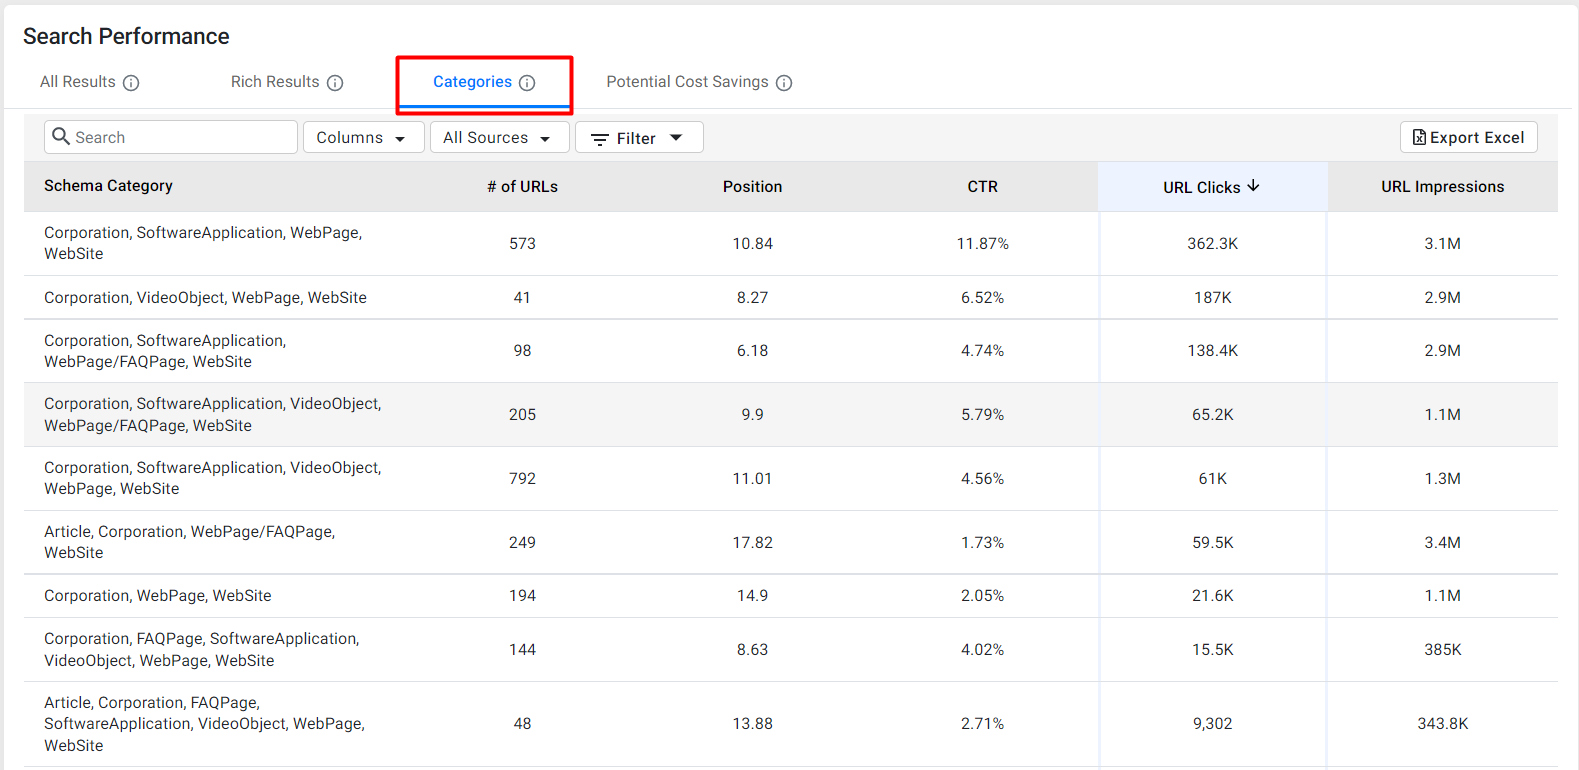
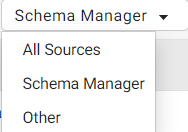
También puede elegir la fuente de los datos: Schema Manager u otras fuentes.
Haga clic en 'Exportar Excel' para descargar una copia de los datos.
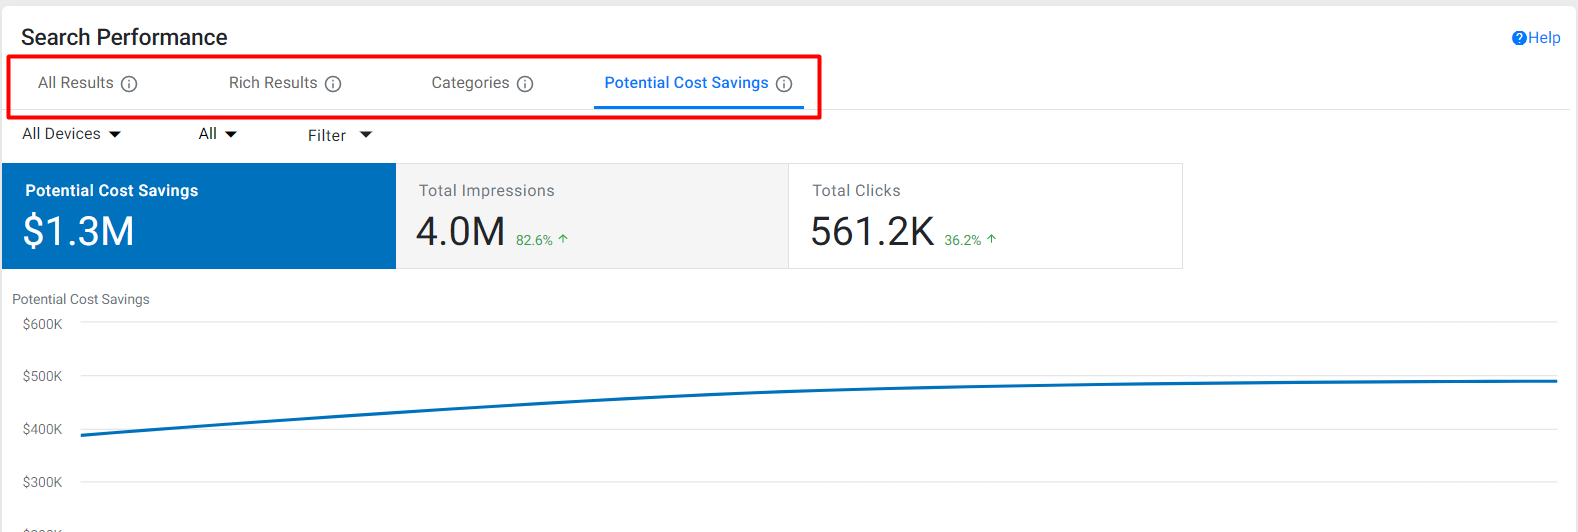
4. Posibles ahorros de costos
La pestaña "Posibles ahorros de costos" le permite ver la cantidad de ahorros de costos generados al implementar el esquema en su página web. Esta pestaña muestra el porcentaje de aumento o disminución en 'Impresiones totales' y 'Clics totales', con los 'Ahorros de costos potenciales' en dólares.
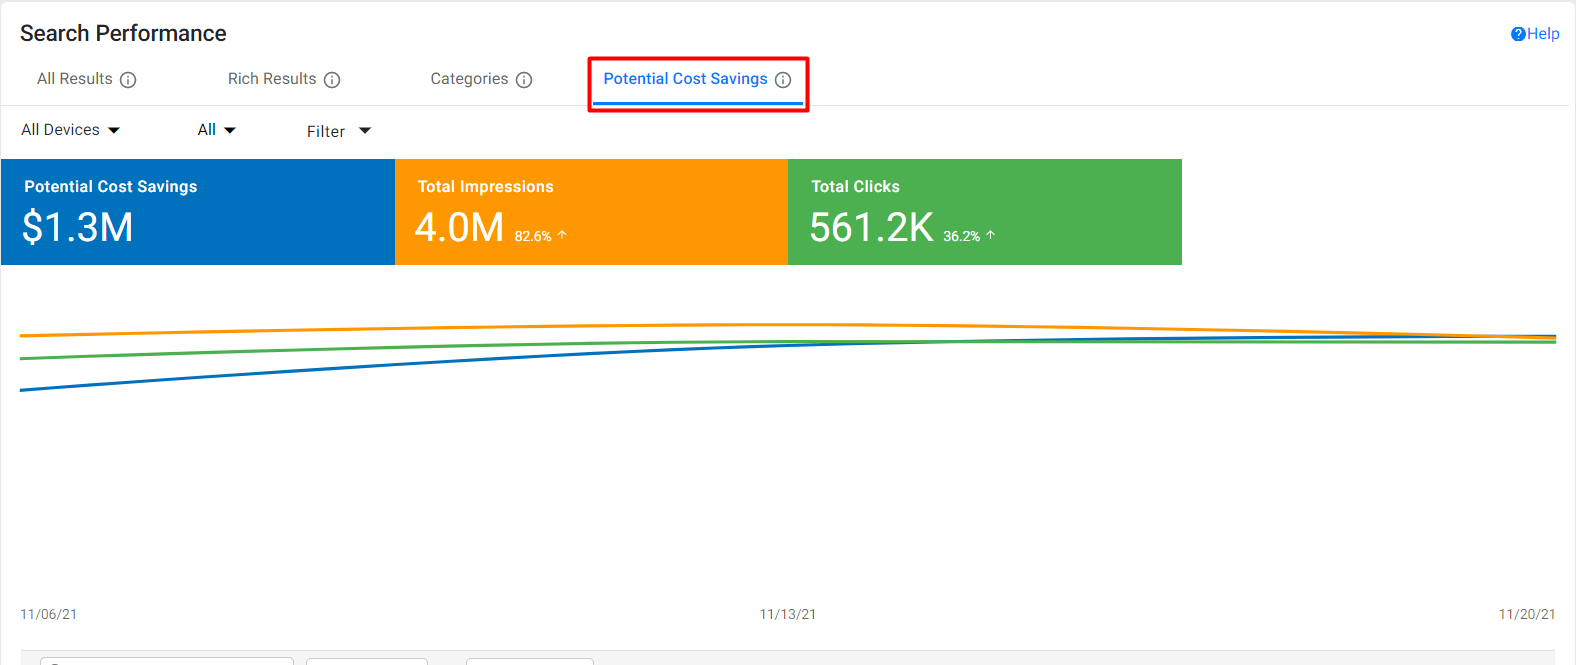
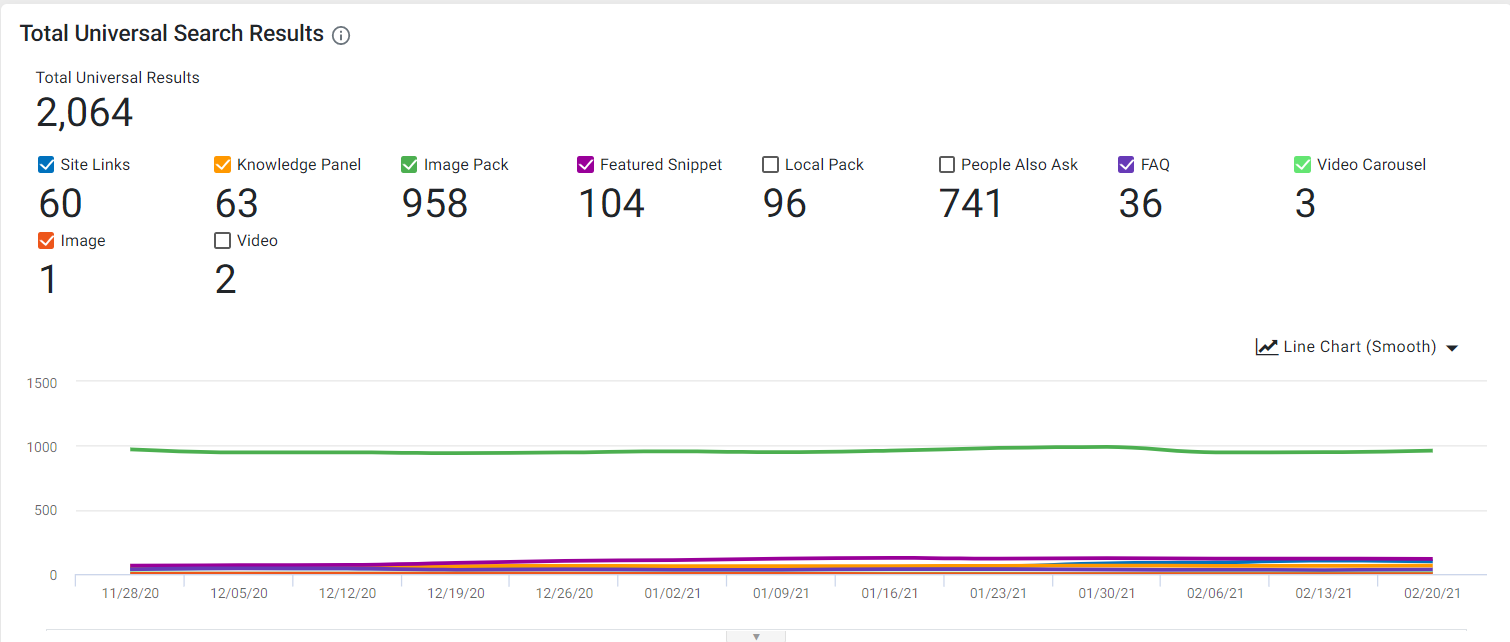
Para el período de fecha seleccionado, también verá los resultados de búsqueda universales totales (básicamente cómo y dónde apareció su contenido web en la búsqueda). También verás los datos de cada búsqueda universal de forma independiente. Haga clic en cualquiera de los resultados de la búsqueda universal para ver su rendimiento en el gráfico de tendencia.
5. Diferencia entre el resumen de rendimiento del esquema y la consola de búsqueda de Google
Milestone Schema Manager garantiza que los datos de rendimiento de las empresas que implementan el esquema se consoliden en una pantalla. Si bien obtenemos datos de Google Search Console, los datos que ofrece Schema Performance Summary van más allá de las limitaciones de GSC en términos de:
- Número de consultas que se pueden obtener a la vez
- Cantidad de datos que se pueden recuperar
- Visualización del rendimiento: rendimiento vinculado a una URL, vista general de los tipos de apariencia de búsqueda, visualización del rendimiento de las categorías de esquema y perspectiva de ahorro de costes potenciales que no está disponible en GSC.
|
Métrica de comparación |
Consola de búsqueda de Google |
Resumen de rendimiento del esquema |
|
Limitación |
Solo 1000 filas de consulta/URL en exportación |
Todo el conjunto de datos, incluidas todas las URL disponibles en la exportación |
|
Retención |
16 meses de datos a partir de la fecha actual |
16 meses de datos antes de la instalación. Todos los datos hasta la fecha de configuración de la publicación |
|
Vistas útiles |
No hay forma de filtrar los datos de rendimiento de las URL a las que se aplicó el esquema desde el Administrador de esquemas |
Una dimensión adicional para ver los datos de rendimiento solo para las URL que están dentro del alcance de la implementación del esquema |
|
Los tipos de apariencia de búsqueda tienen vistas individuales |
Vista unificada de todos los tipos de apariencia de búsqueda además de las vistas individuales |
|
|
Los datos de la página y la consulta están separados. |
Fácil de ver las consultas relacionadas con una URL |
|
|
Sin asignación de esquema a URL |
Asignación de URL a esquema: las vistas asociadas lo ayudan a saber qué combinaciones de esquema funcionan bien |
|
|
N / A |
Los posibles ahorros de costos le brindan una idea sobre el valor potencial en dólares que se ahorra al implementar Schema |