Contenido y relevancia
La sección Contenido y relevancia proporciona información sobre el contenido de su sitio web y su rendimiento para las palabras clave en todos los canales y dispositivos.
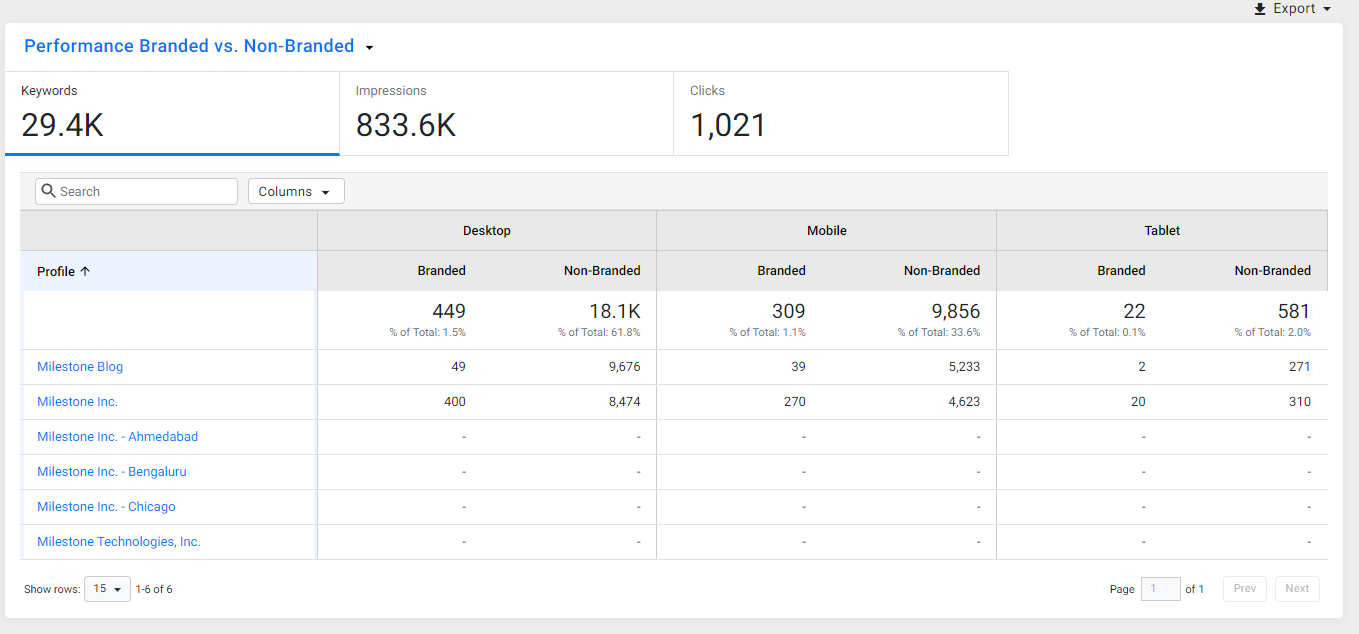
La sección Rendimiento del contenido muestra el rendimiento del contenido para búsquedas de marca y sin marca en todos los canales y dispositivos. También muestra los tipos de funciones de búsqueda que activa su contenido.
Rendimiento del contenido
Vista empresarial
Al hacer clic en la pestaña 'Rendimiento del contenido' en 'Contenido y relevancia', verá la lista de URL y el rendimiento de su contenido en los tipos de búsqueda.
 Puede cambiar los tipos de búsqueda utilizando este menú desplegable.

Seleccione un KPI para ver el rendimiento de su contenido en todos los dispositivos y tipos de búsqueda.
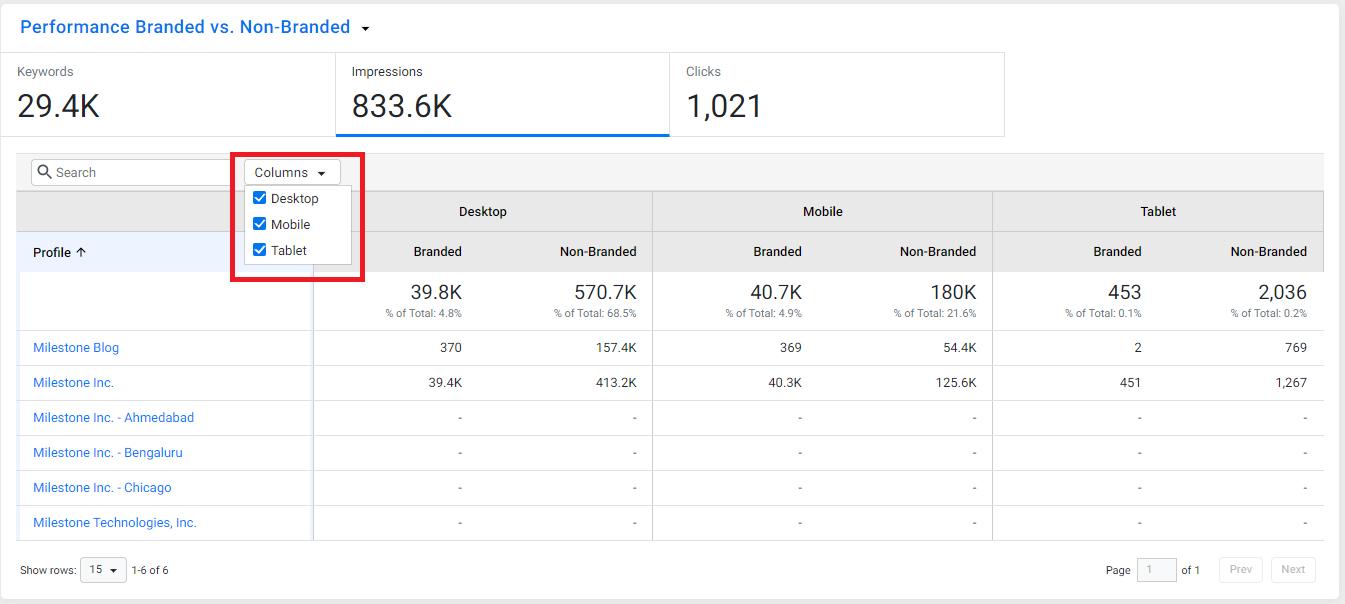
Use el menú desplegable 'Columnas' para seleccionar y ver datos por dispositivo.
También puede optar por descargar un informe de los datos del rendimiento general de su contenido empresarial haciendo clic en 'Exportar'.
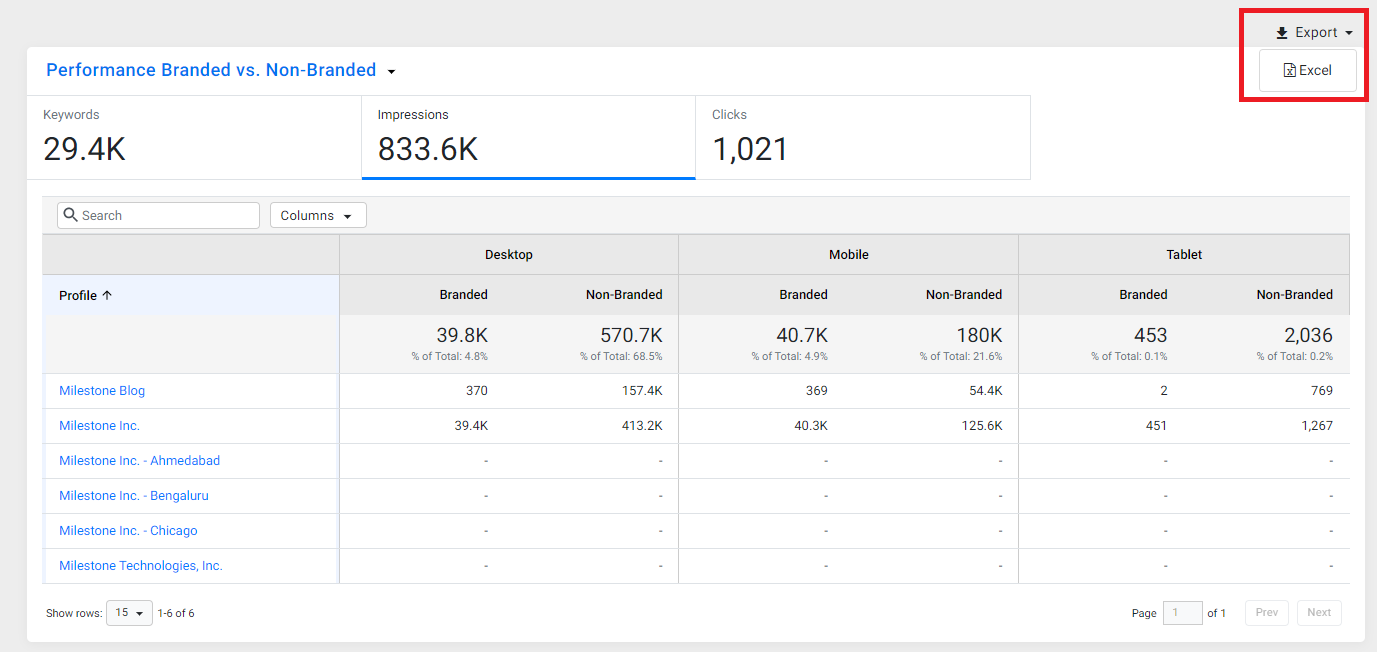
Ahora, para ver el rendimiento del contenido de un perfil seleccionado, haga clic en el perfil.

por perfil
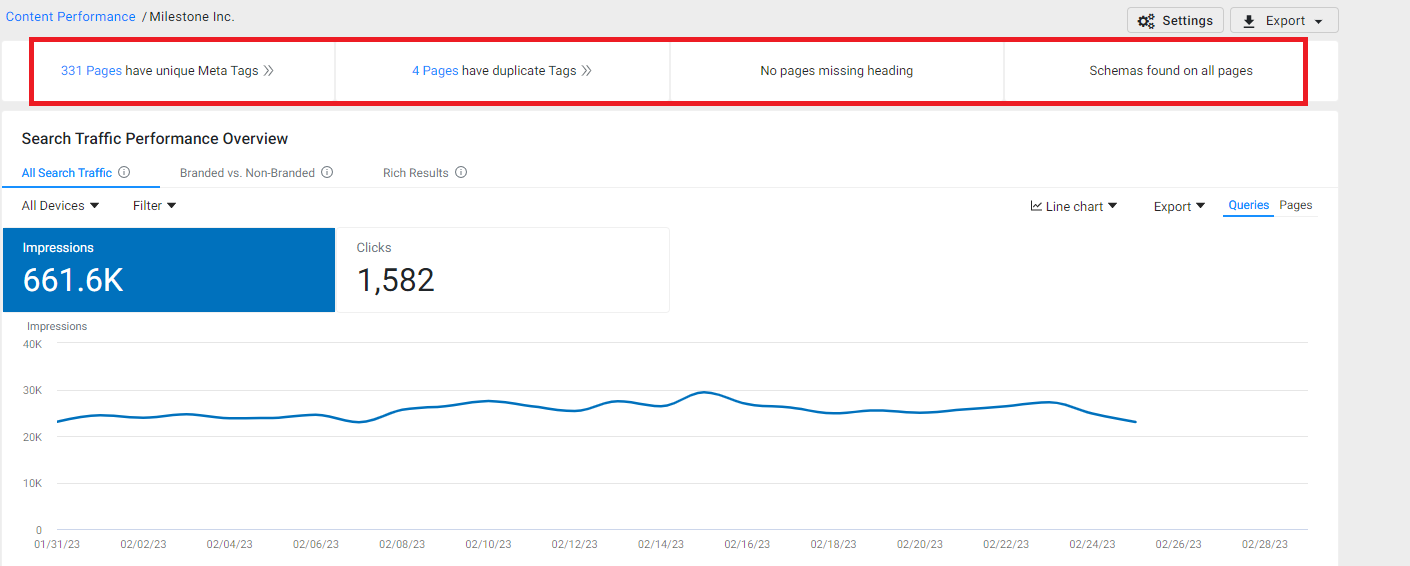
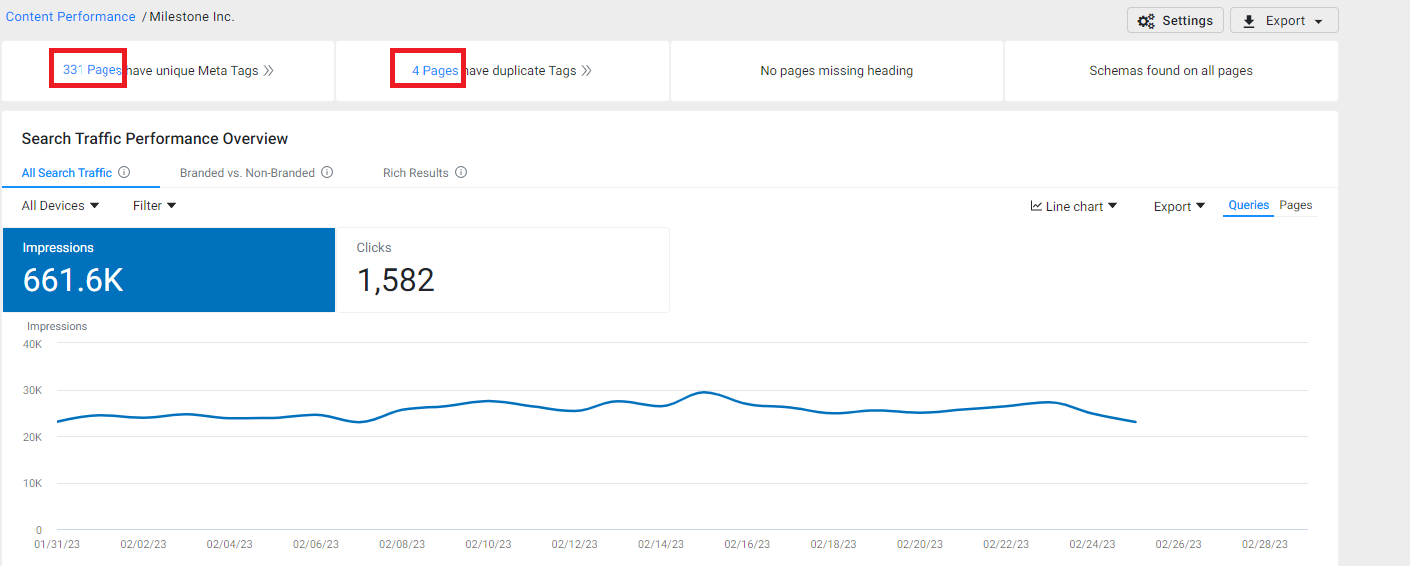
En la parte superior, la sección de verificación del estado general del contenido le muestra si su contenido tiene todos los elementos básicos necesarios para ser descubierto en la búsqueda o si hay algún error presente en estos elementos . Esto incluye la presencia de metaetiquetas, etiquetas duplicadas, encabezados y esquemas.
Para ver páginas con metaetiquetas únicas o etiquetas duplicadas, haga clic en el número resaltado en azul.
Funcionalidades del panel
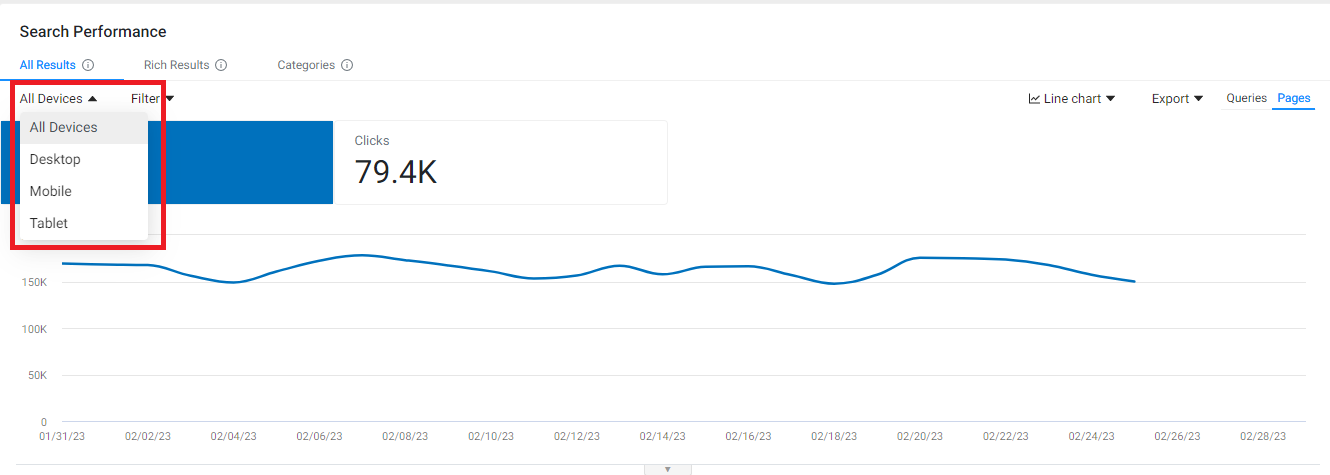
Puede filtrar los clics y las impresiones en todos los dispositivos mediante el menú desplegable.
También puede utilizar los filtros para acotar su búsqueda.

A la derecha, use el menú desplegable para elegir su tipo de gráfico.

Si desea descargar su actuación, haga clic en 'Exportar' y haga clic en 'Programar'.

Al usar la palanca, puede ver sus datos por consultas de búsqueda o páginas (URL).
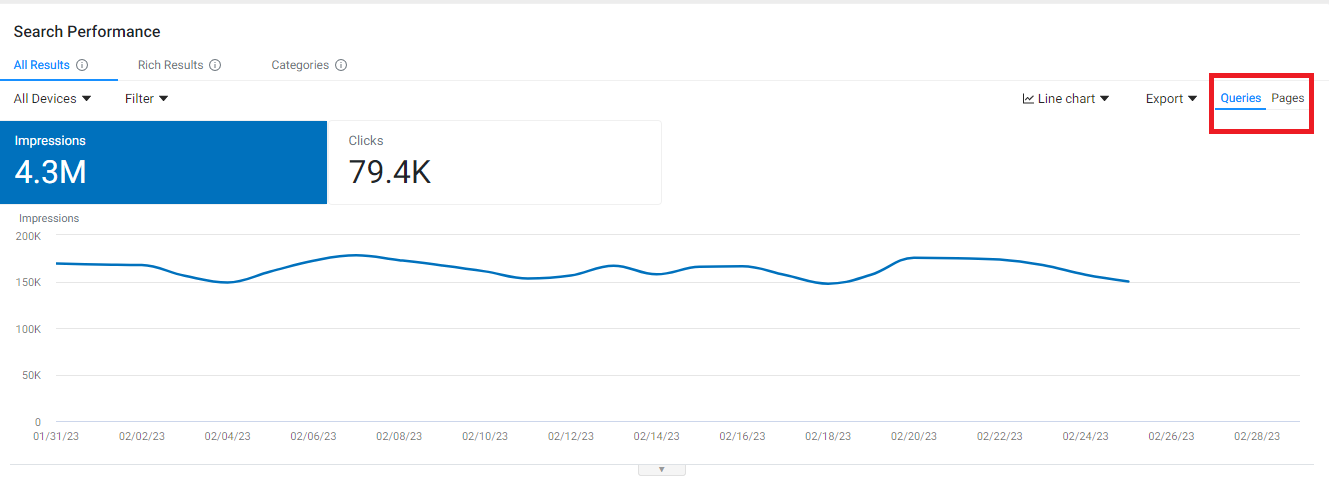
Debajo del gráfico de tendencia, verá el rendimiento de sus consultas.

Rendimiento del tráfico de búsqueda
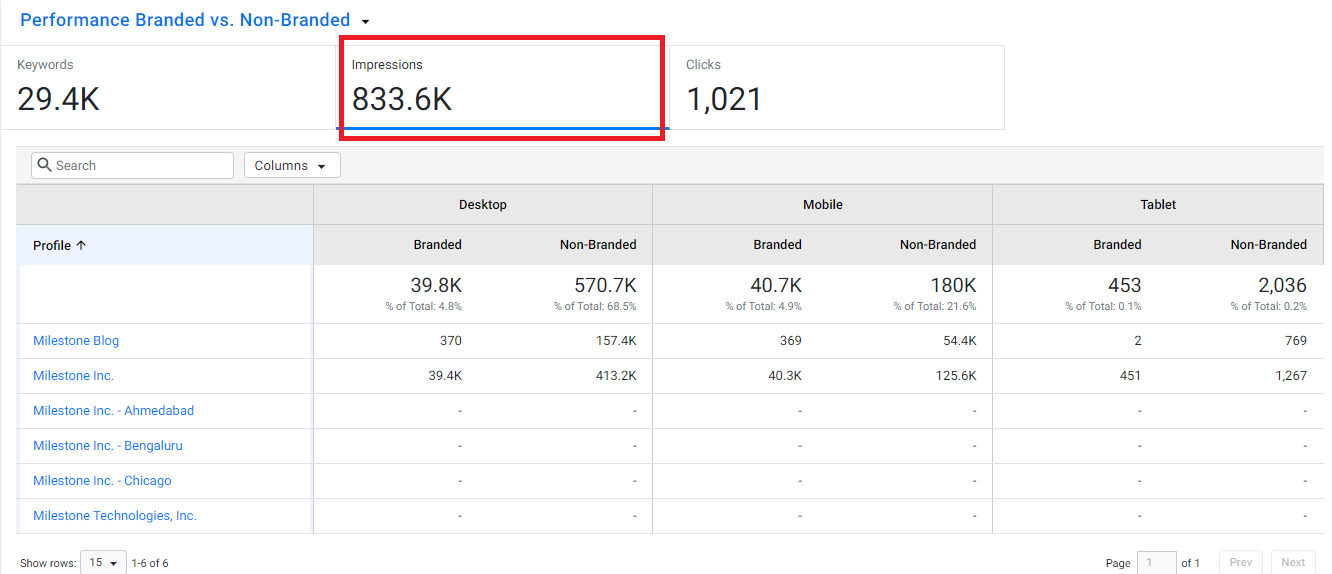
En este widget, puede ver el rendimiento de su tráfico de búsqueda en todos los resultados, de marca vs. sin marca y resultados enriquecidos en términos de clics e impresiones. Para el tipo seleccionado, vea el rendimiento en el gráfico de tendencia.
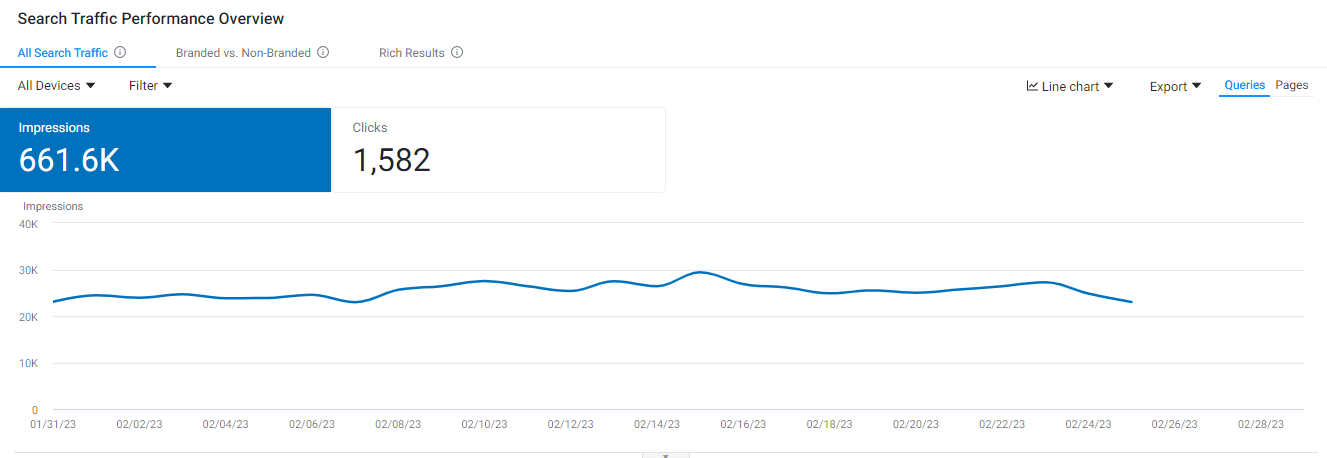
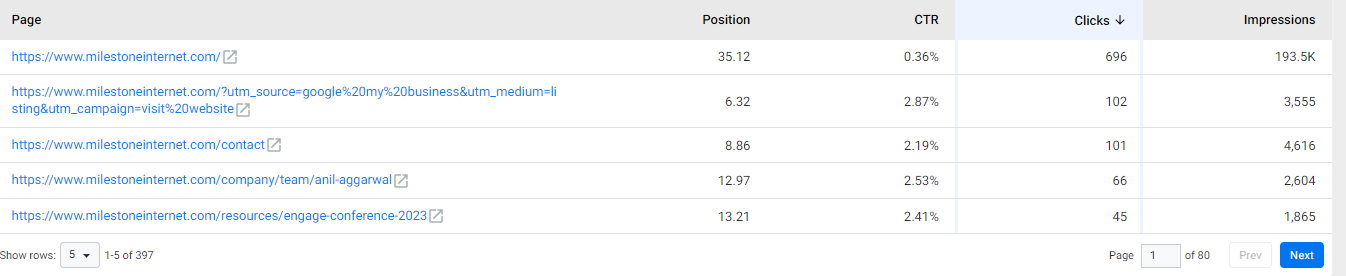
Desplácese hacia abajo para ver el rendimiento por páginas/consultas en términos de posición de búsqueda, clics, impresiones y CTR.
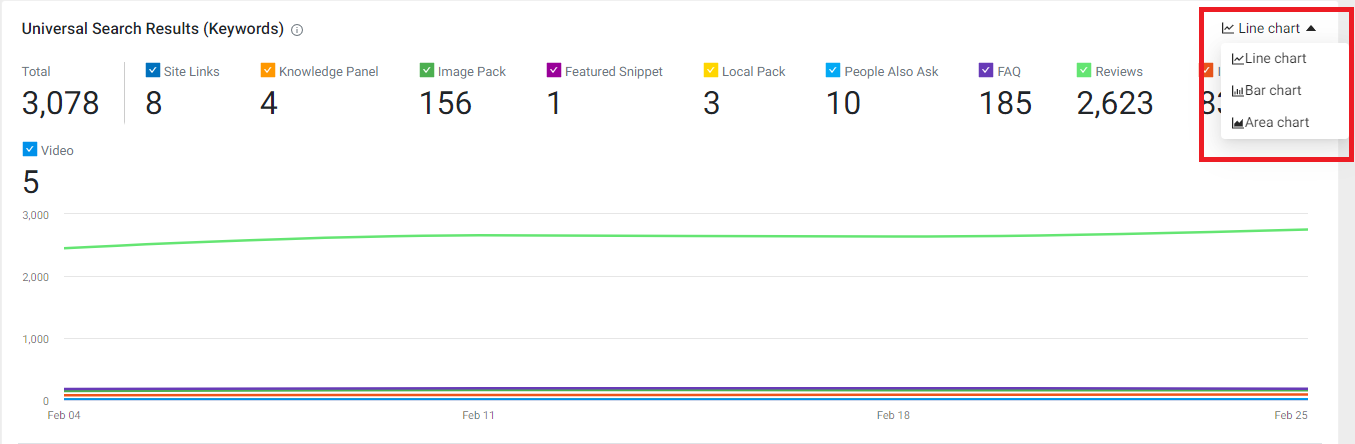
Resultados de búsqueda universal (palabras clave)
La sección Resultados de la búsqueda universal muestra los tipos de funciones de búsqueda que activan las palabras clave de su sitio web. A la derecha, puede usar el menú desplegable para cambiar el tipo de gráfico que se usa para mostrar los datos.
Oportunidades de temas adicionales
Las " Oportunidades de temas adicionales " muestran otras consultas para las que aparecen sus páginas web y pueden brindarle oportunidades de temas que pueden mejorar su clasificación general y visibilidad en la búsqueda.

Palabras clave y SERP
La sección Palabras clave y SERP muestra el rendimiento de su contenido en función de sus volúmenes de búsqueda de marca y sin marca y las SERP para las que su sitio web se clasifica en ellos.
El gráfico de clasificación de palabras clave muestra 4 tipos de datos: instantánea de hoy, palabras clave clasificadas, características SERP, est. Tráfico Mensual.
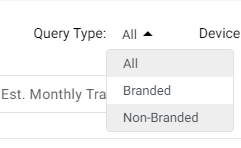
 Puede filtrar los datos por tipo de consulta: de marca vs. sin marca
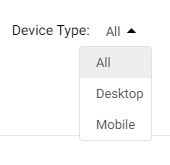
Tipo de dispositivo: todos, de escritorio o móviles.
Puede optar por descargar los datos en un Excel haciendo clic en 'Exportar'.
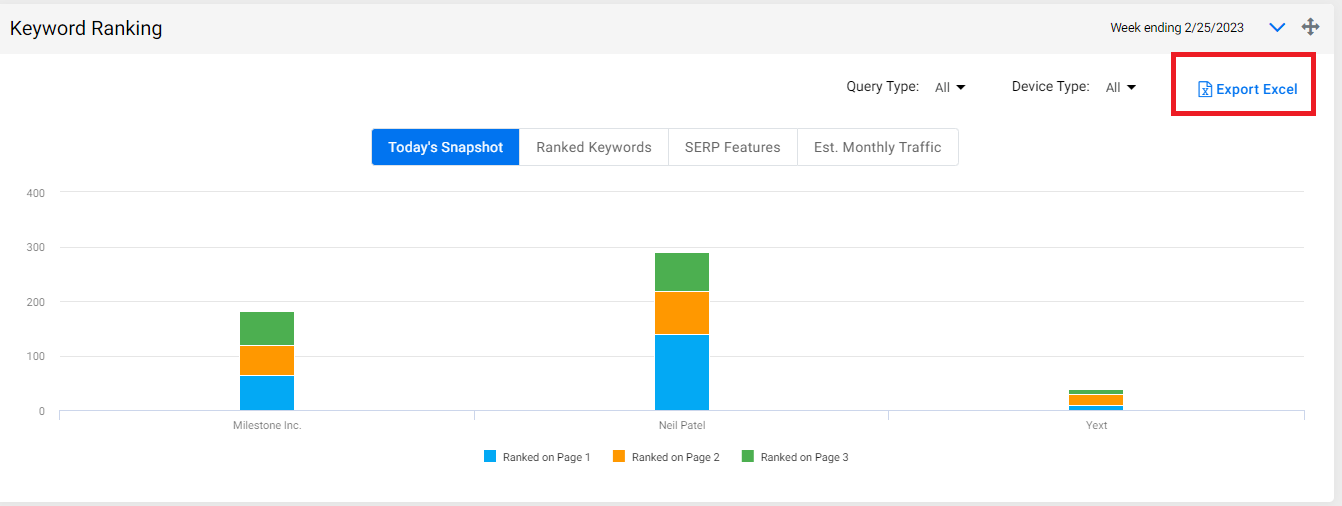
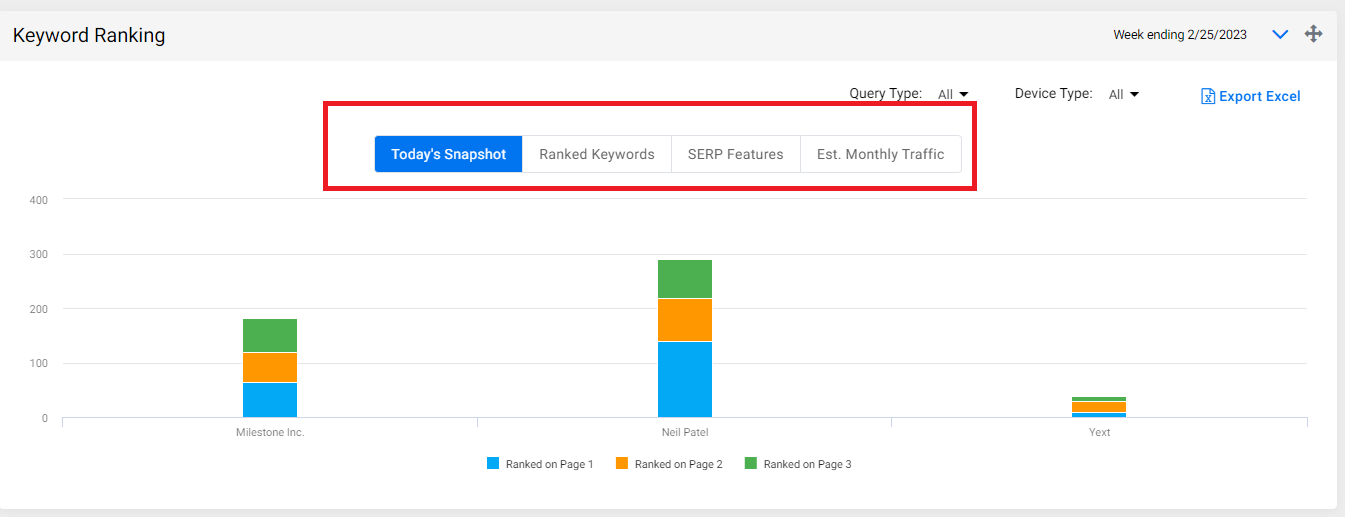
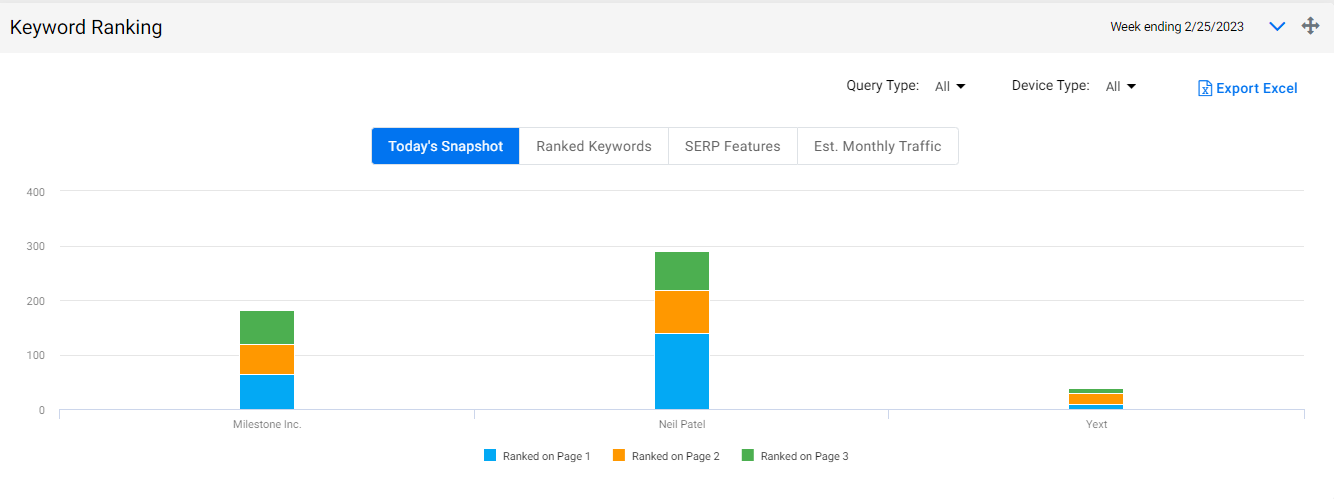
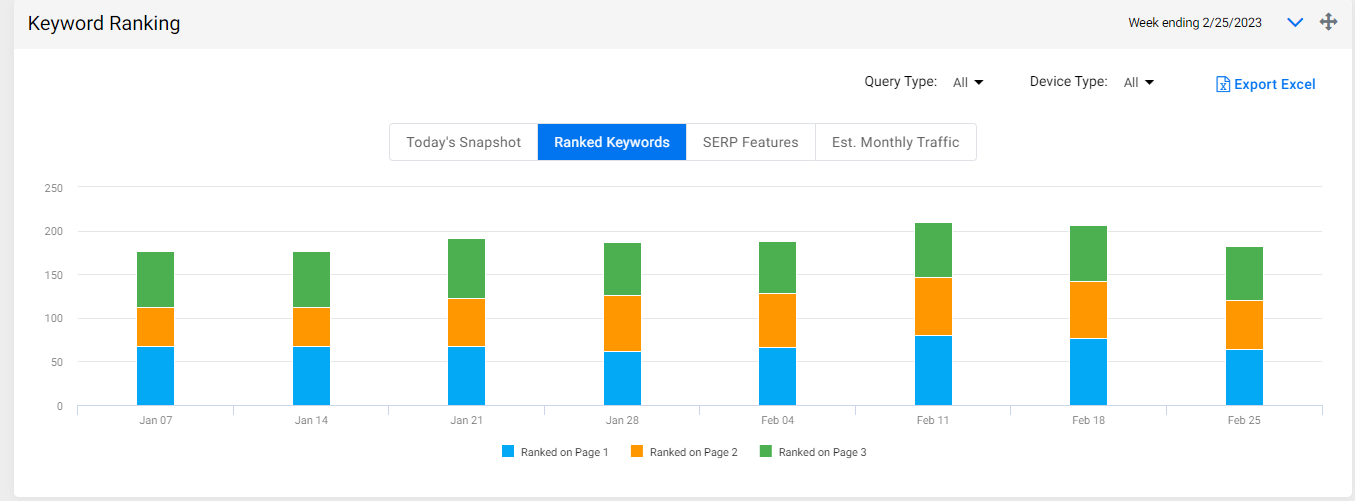
Clasificación de palabras clave
La instantánea de hoy muestra una vista comparativa de su clasificación y la de su competidor para varias palabras clave de marca y sin marca en las páginas 1, 2 y 3 de SERP.
Las palabras clave clasificadas muestran una vista semanal de los volúmenes de búsqueda y las SERP en las que ha estado apareciendo . Al hacer clic en el gráfico de barras , puede ver las consultas que clasificó en las páginas 1, 2 y 3 de SERP .
La pestaña de funciones SERP muestra la cantidad de palabras clave que activan las funciones del motor de búsqueda. Estas características se dividen en 3 categorías amplias.
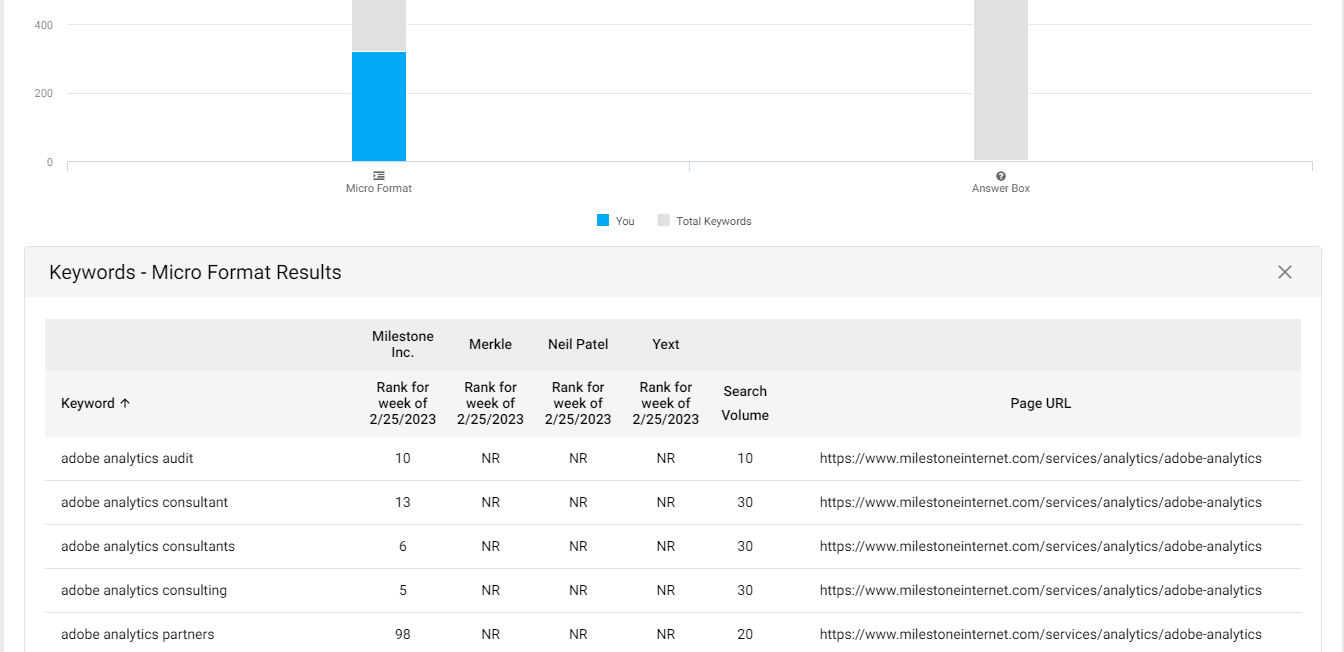
- Microformato: estos permiten que los motores de búsqueda comprendan el contenido de su sitio web y muestren contenido específico para SERP.
- Cuadro de respuesta: permita que su contenido se muestre en el formato de preguntas y respuestas que aparece en los resultados de búsqueda orgánicos
- Los resultados del paquete de marca muestran información comercial específica como dirección, número de teléfono, imágenes, etc.
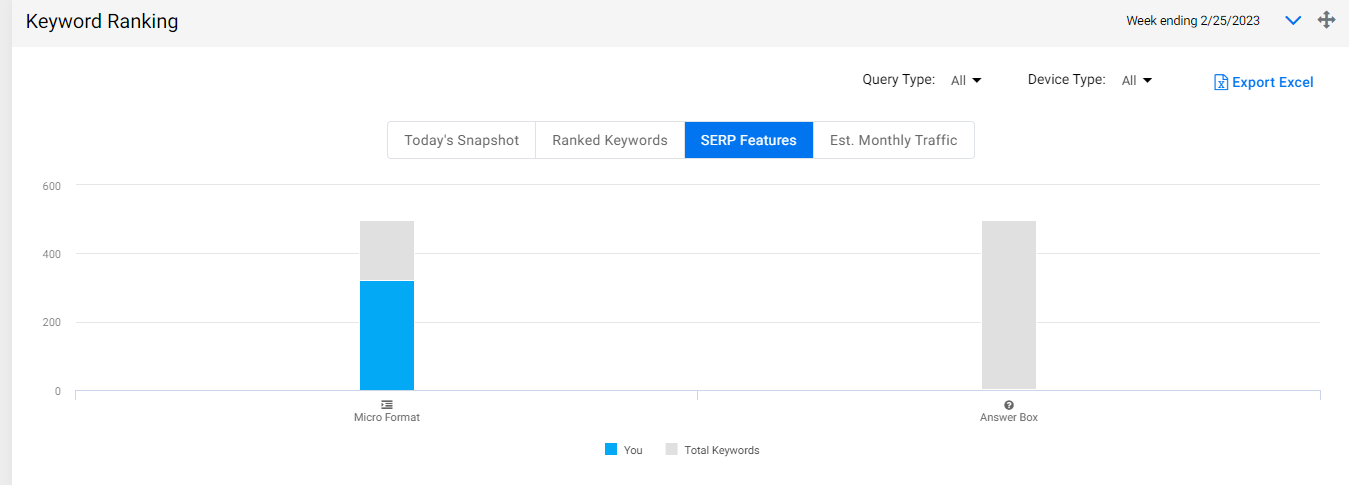
Al hacer clic en el gráfico de barras , puede ver qué consultas activan estas funciones.
El tráfico mensual estimado muestra una comparación del rendimiento de su contenido con el de la competencia.

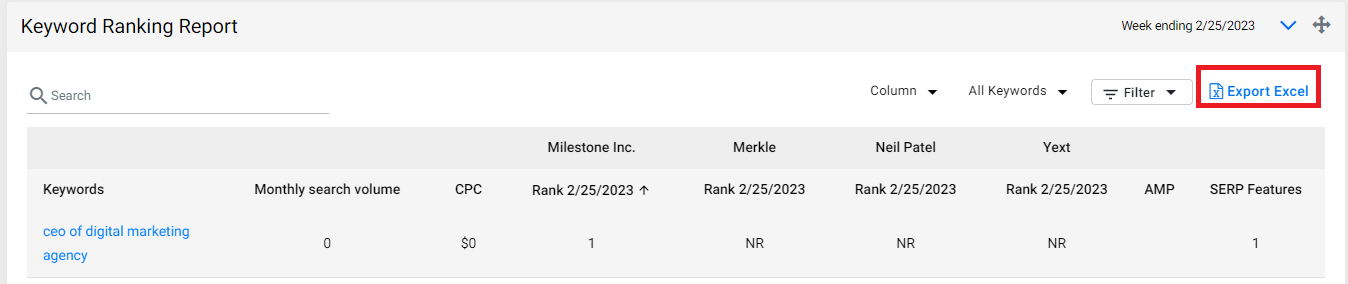
Informe de clasificación de palabras clave
El informe de clasificación de palabras clave muestra las palabras clave que sus competidores y usted clasifican en los primeros 3 SERP.
En este informe, puede ver el volumen de búsqueda mensual de cada palabra clave, el costo por clic, su clasificación y la de sus competidores en la fecha proporcionada en la parte superior de la columna, la clasificación AMP, las funciones SERP activadas por las palabras clave, etc.
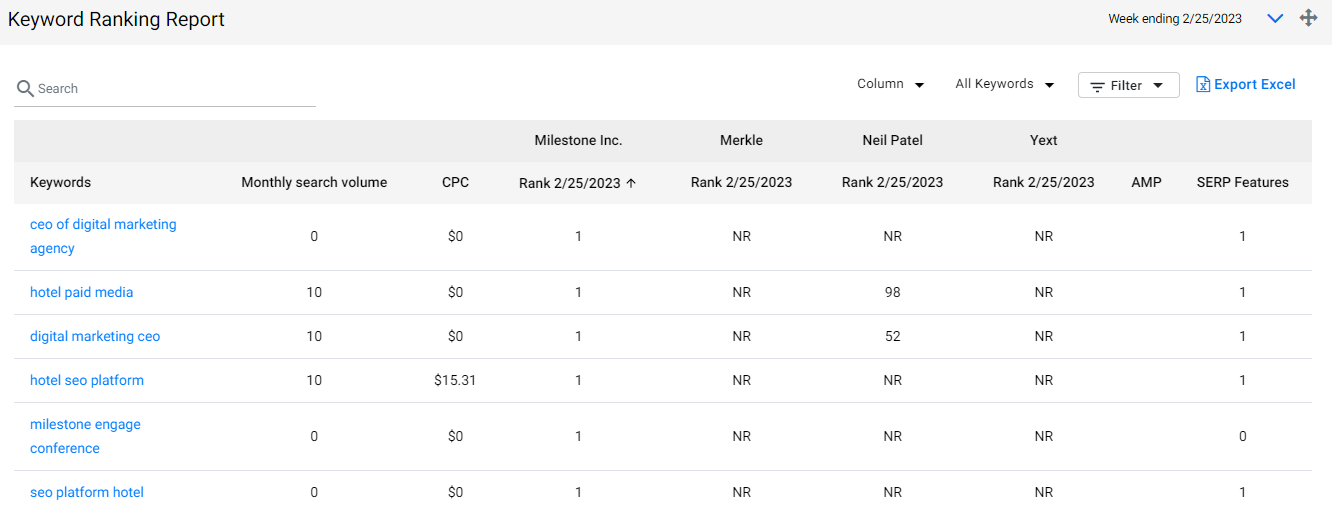
En la parte superior de la tabla, puede agregar o eliminar columnas de datos usando el menú desplegable de columnas

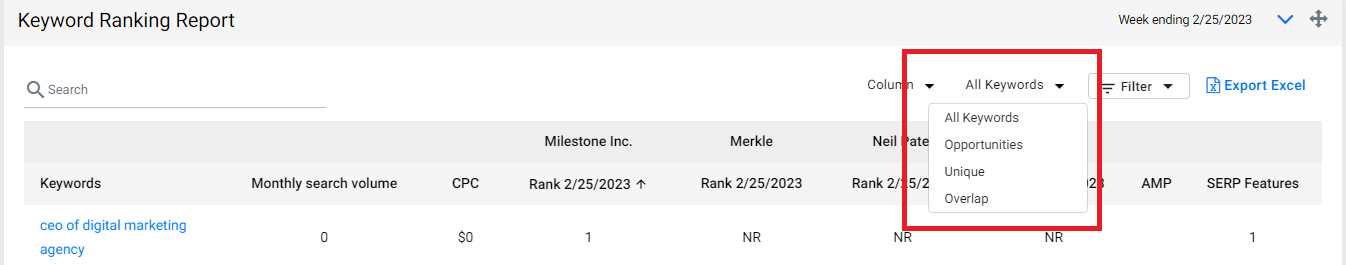
También puede filtrar los tipos de palabras clave que aparecen en este informe, que pueden ser oportunidades de palabras clave, palabras clave únicas y palabras clave superpuestas.
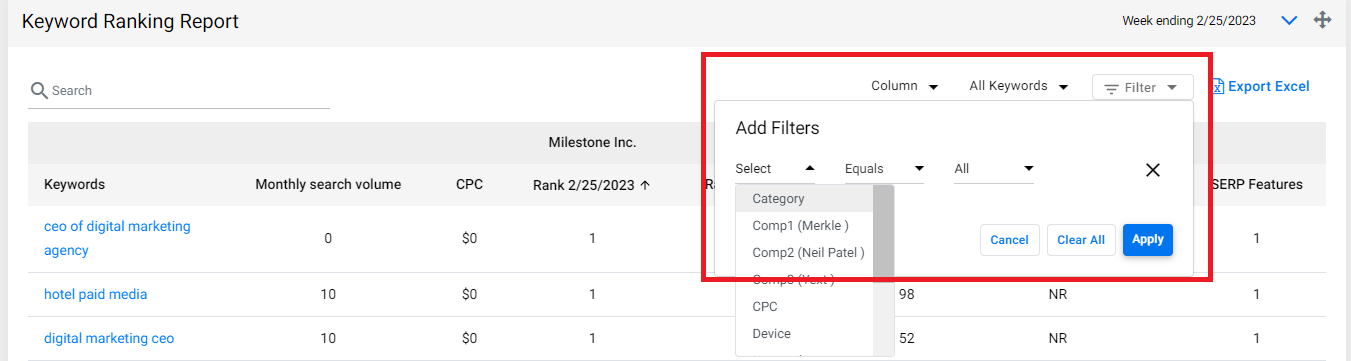
El menú desplegable Filtros le permite dividir y trocear los datos usando una variedad de filtros.
También puede exportar el informe de clasificación de palabras clave a una hoja de cálculo para verlo y redistribuirlo sin conexión.